Sandbox
Take me to the SandboxGetting Started
Before you begin, make sure you have an approved Data Use Certification (DUC) otherwise you will be unable to access the environment/data.
For more information about applying for a DUC, please refer to the NBDC Data Hub.
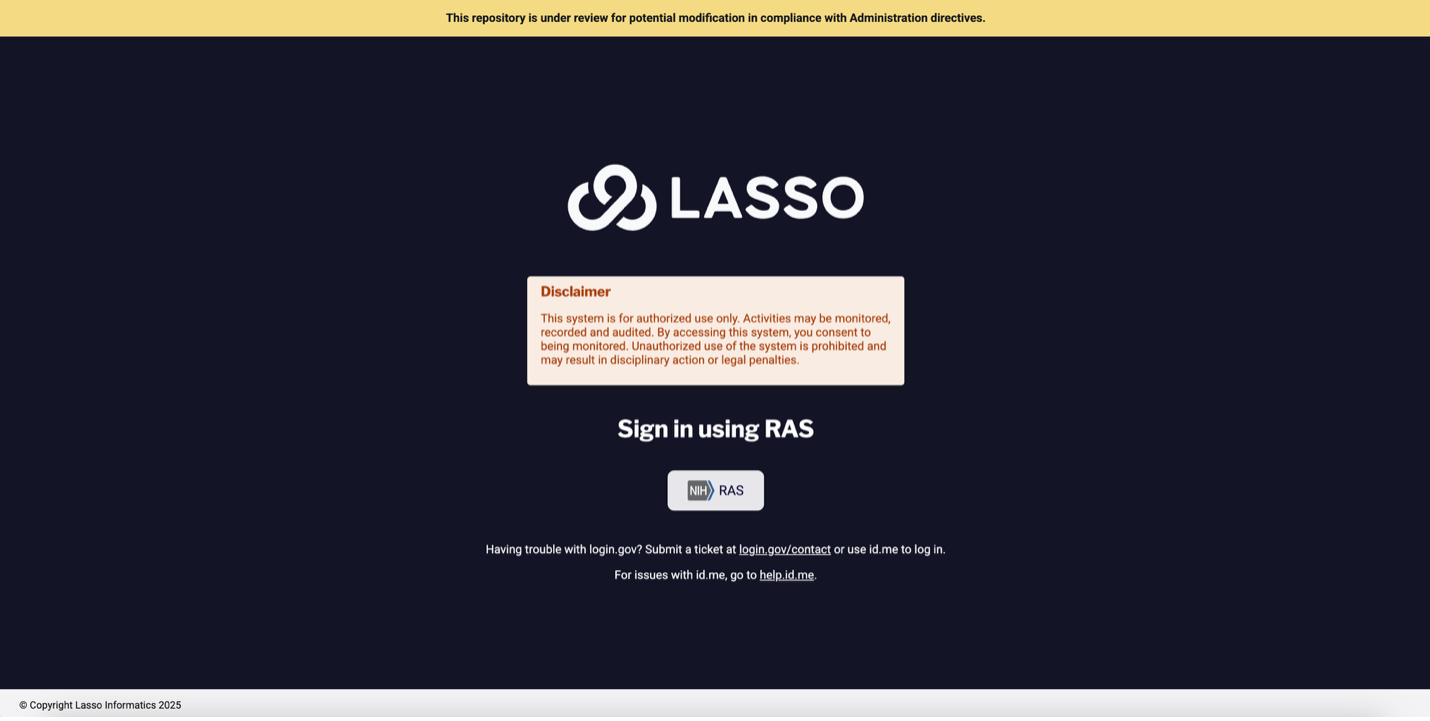
If you have an approved DUC, access the Lasso Sandbox environment here: https://nbdc-datashare.lassoinformatics.com/
Sign in using RAS (the same log in you used to apply for your DUC)
Setting Up and Using the Sandbox Environment
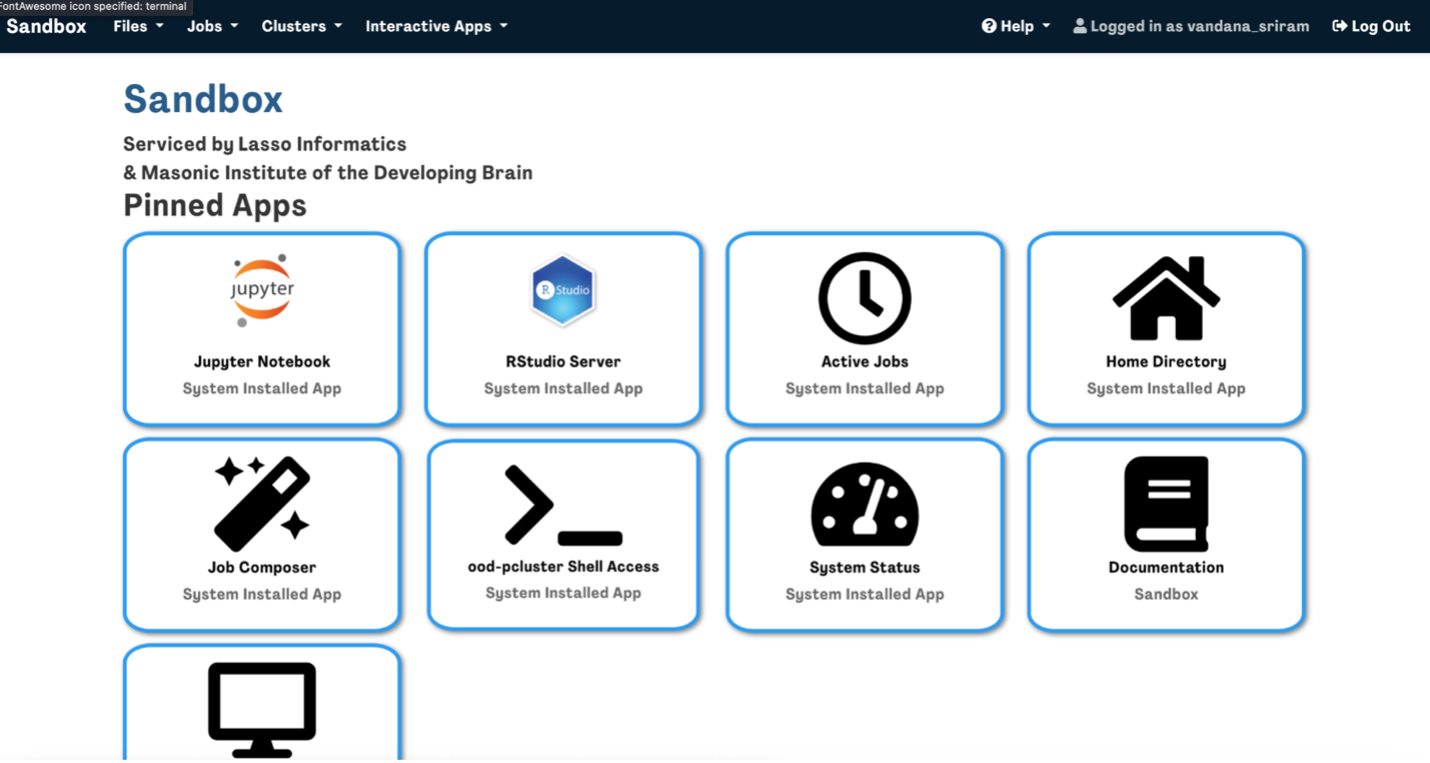
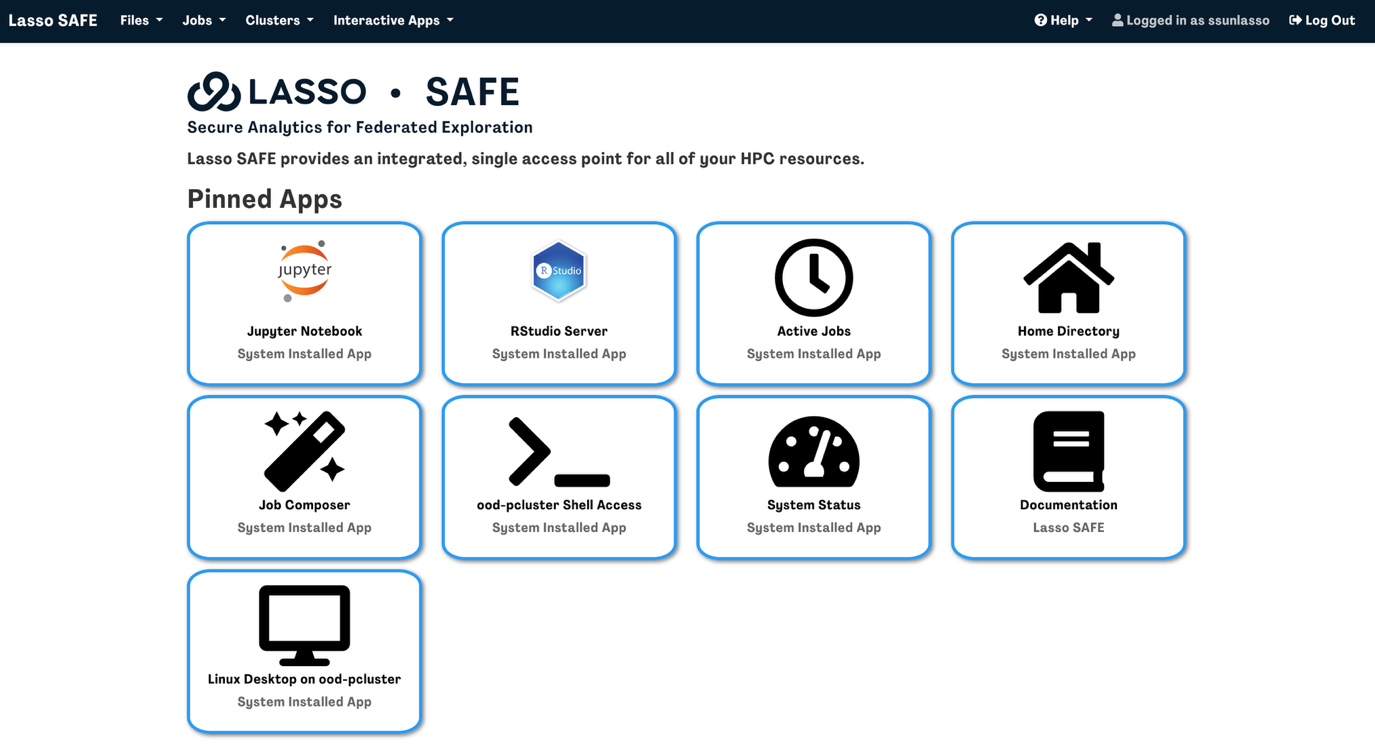
- From the left-hand side menu, click on the Sandbox module.
Two Sandbox environment options are visible to users on the left-hand side menu bar, Sandbox Interactive and Batch:- The Sandbox Batch environment is best for running larger jobs (e.g., neuroimaging analyses)
- The Sandbox Interactive environment is best for running smaller jobs (e.g., visualizing tabular data)
- The first time you use it, you’ll be prompted to create your environment.

- Click “Create My Environment”. The setup will take a few seconds.
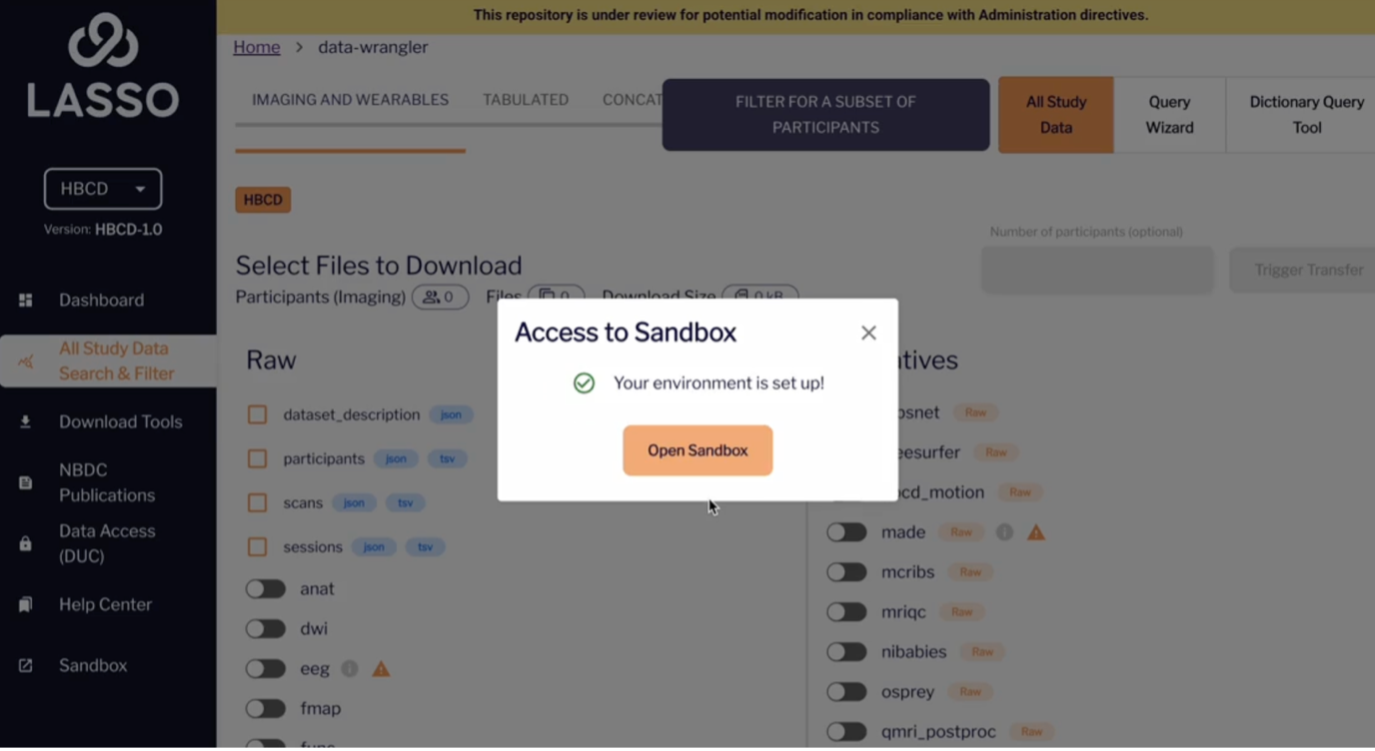
- Once complete, your environment will be ready, and you can begin using it to access tabulated data using R or Jupyter.
Accessing the NBDC Data
Accessing the NBDC Data
NOTE: AS OF DEC 11, 2025, THE ABCD DATA FILES CONTAIN RELEASE 6.1 DATA; PLEASE IGNORE THE ERRONEOUS 6.0 LABELS IN THE SANDBOX SYSTEM.
There are several ways to access NBDC data in Lasso SAFE:
- Via import into RStudio or Jupyter Notebook interactive sessions (immediate)
- Via the Linux Desktop
- File Manager (delay)
- Terminal (immediate)
Not sure, what you need?
Choose Your Path:
Import NBCD data into RStudio or Jupyter Notebook
If you want to manipulate the data and perform analyses with the data, you can do so by importing them into RStudio or Jupyter Notebook.
You can import data files from the ABCD and HBCD directories into RStudio or Jupyter Notebook to conduct your analyses using the respective file paths:
- ABCD: /shared/release/abcd/dairc_files/rawdata/phenotype
- HBCD: /shared/release/hbcd/v2.0/hbcd/rawdata/phenotype
An example in RStudio and Jupyter are shown below.
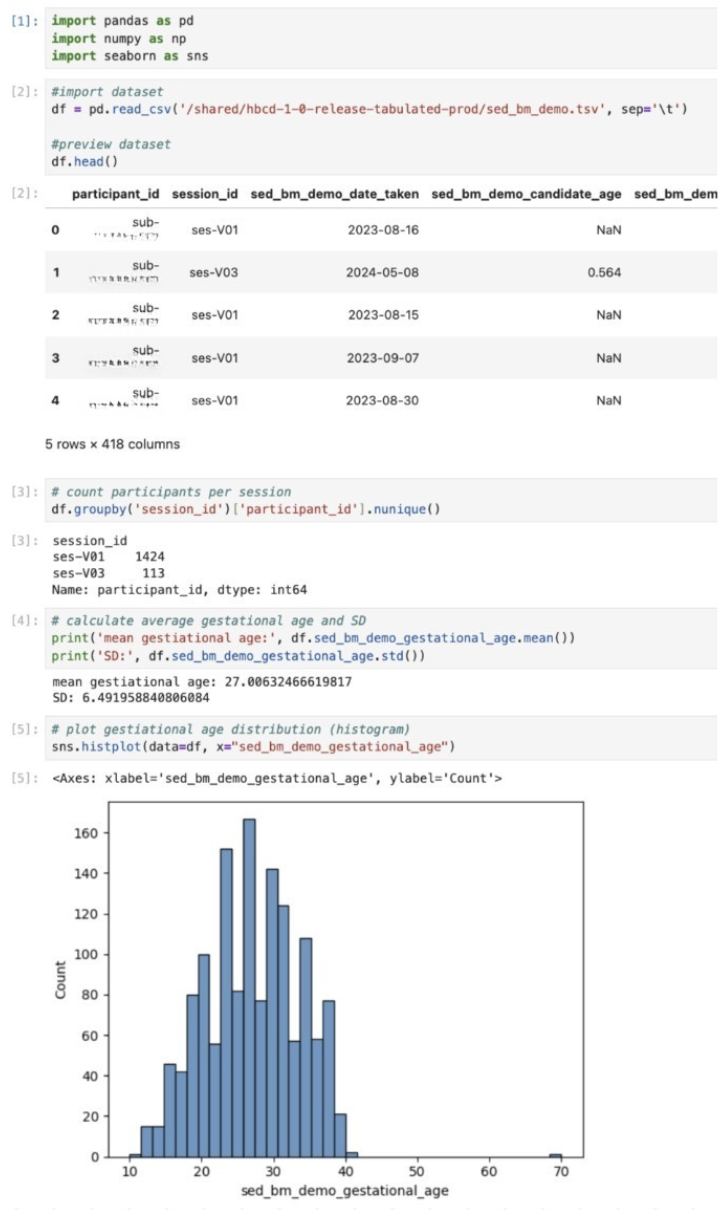
RStudio example
Here is an example sample script using RMarkdown (the loaded libraries were pre-installed).
Tip: NBDCtools is an R package specifically developed for working with NBDC data. To install this package please follow the instructions here.

Jupyter example
Here is an example sample script using Jupyter Notebook (the loaded modules were pre-installed).
TIP: How to find the file you’re looking for from Jupyter/RStudio
The tabulated NBDC data are stored in tsv and parquet files based on their table name. If you are unsure which table contains your variables of interest, you can consult the data dictionary in the data access platform.
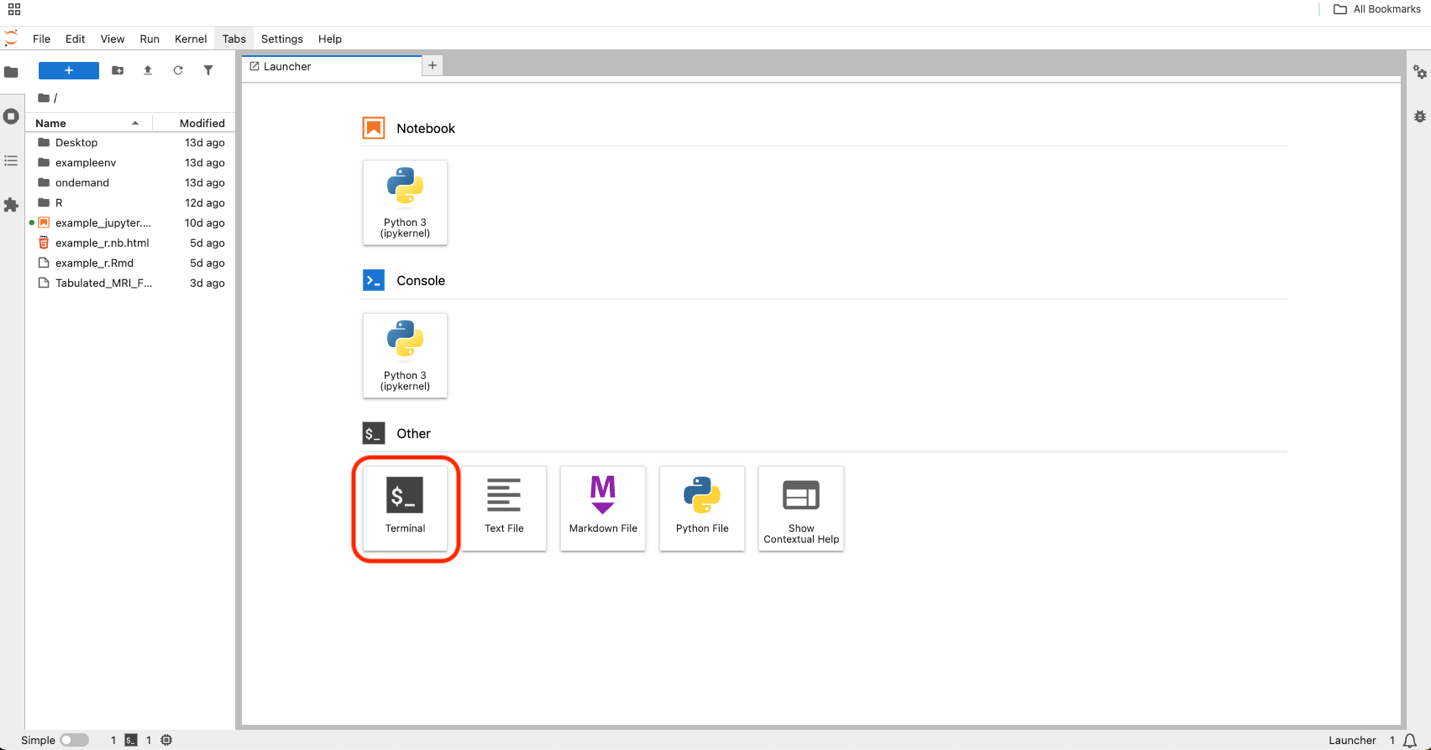
To quickly view the list of files from your Jupyter/RStudio session, you can open the terminal within the session to parse through the files.
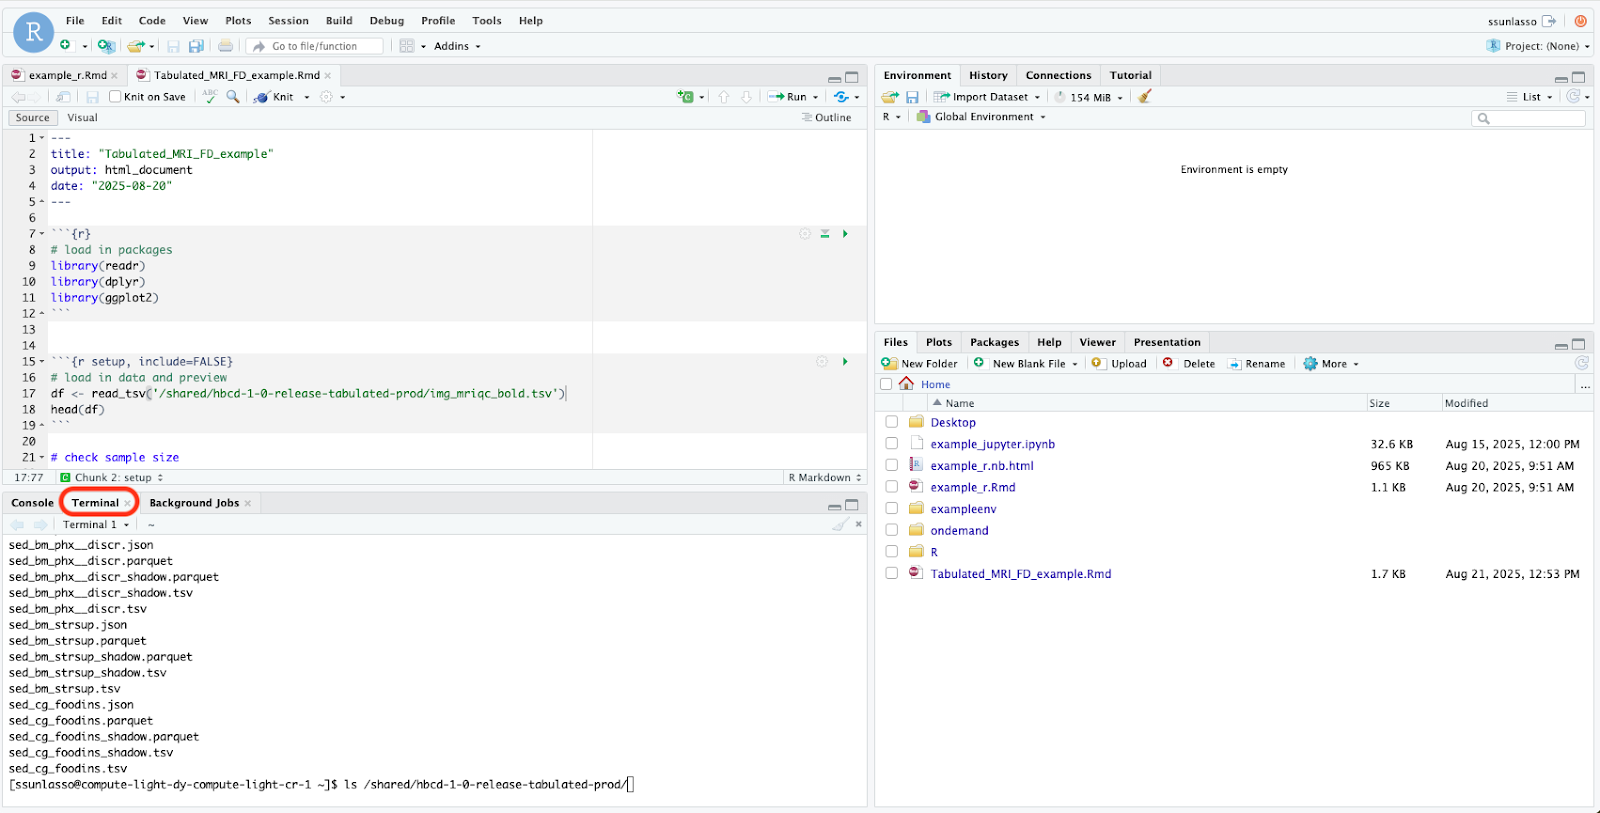
Type the following into the command line to view the list of files inside the ABCD and HBCD directories and press enter:
- ABCD: /shared/release/abcd/dairc_files/rawdata/phenotype
- HBCD: /shared/release/hbcd/v2.0/hbcd/rawdata/phenotype
This command (ls) tells the computer to list what’s inside that file path.
Data Access Via Linux Desktop
If you need to browse the data files, you can access the NBDC data using the Linux Desktop by opening an interactive Linux desktop on one of the clusters by either:
- Clicking on “Linux Desktop on ood-pcluster” from the homepage

OR
- Clicking Interactive Apps followed by Linux Desktop on ood-pcluster
Specify Resource, Project/Account, Wall Time (hours), and Number of nodes based on your needs (or leave it on the default specifications if you are unsure) and press Launch.
- Resource is how much hardware or software you require. There are 3 possible configurations to choose from with example use cases:
- 4 cores, 16 GB (Lightweight Interactive Jupyter/RStudio use, small datasets, basic visualization and scripting)
- 8 cores, 32 GB (Moderate Jupyter/RStudio sessions, larger data manipulation, basic parallel processing
- 16 cores, 128 GB (Batch Classic imaging processing (FSL, ANTs) without GPU)
- Project/Account is the allocation or budget for your research group’s use. If you’re unsure, leave it on default.
- Wall Time (hours) is the time your session runs before it is killed. If your wall time ends before you’re finished with your analyses, you can always start a new session.
- Number of Nodes is how many servers you want to run your interactive session on. For typical RStudio and Jupyter Notebook analyses, you will only need 1 (default).
NOTE: There may be a delay before your interactive session is ready to launch. You can select “I would like to receive an e-mail notification when the session starts” to be notified when the session is ready for you.
You will be automatically directed to the “My Interactive Sessions” page and once your session is ready, you can click “Launch Linux Desktop on ood-pcluster" to start your session.
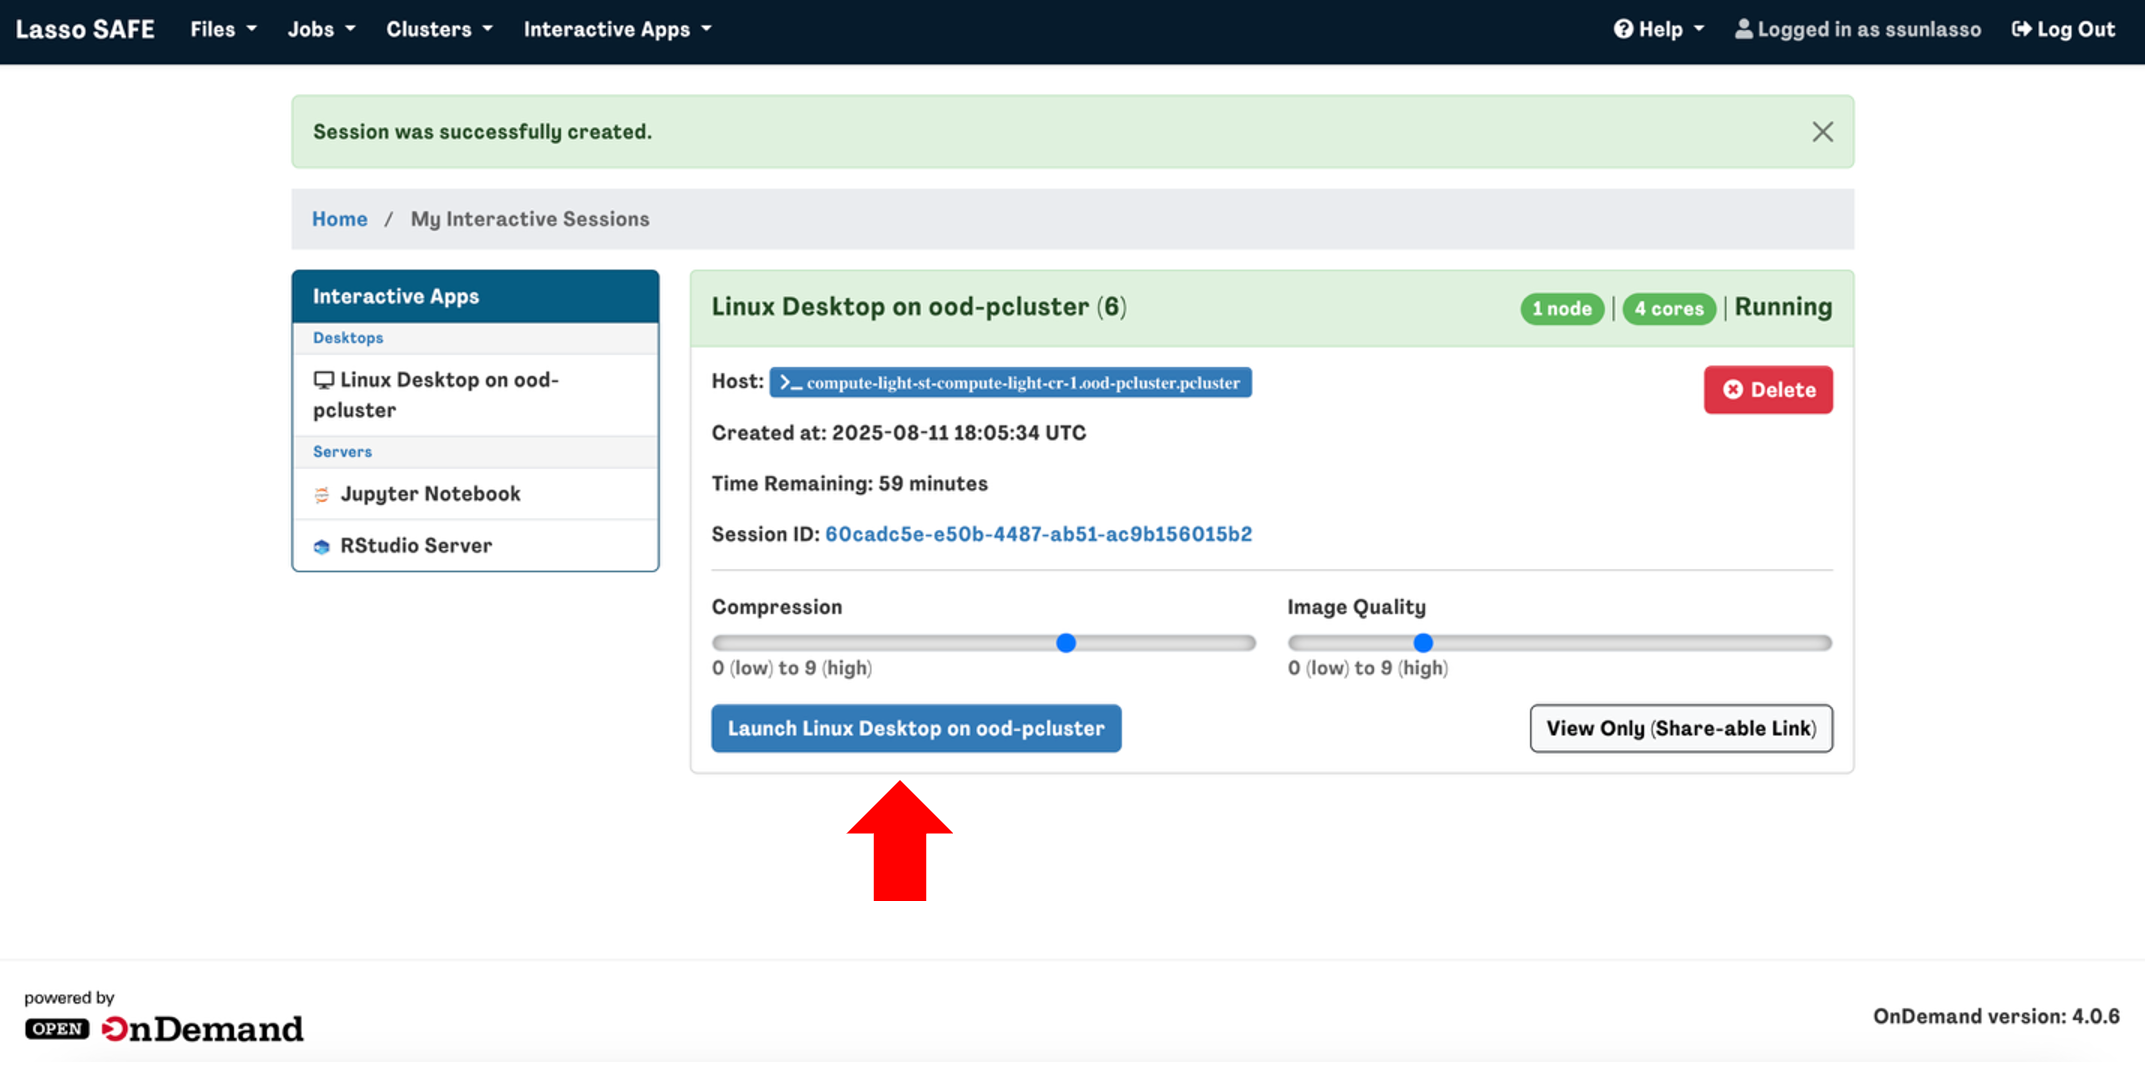
Note: If you finish your interactive session before the allotted wall time expires, please terminate the session by clicking Delete to free up resources for other users in the queue.
Access data via the Linux desktop file manager
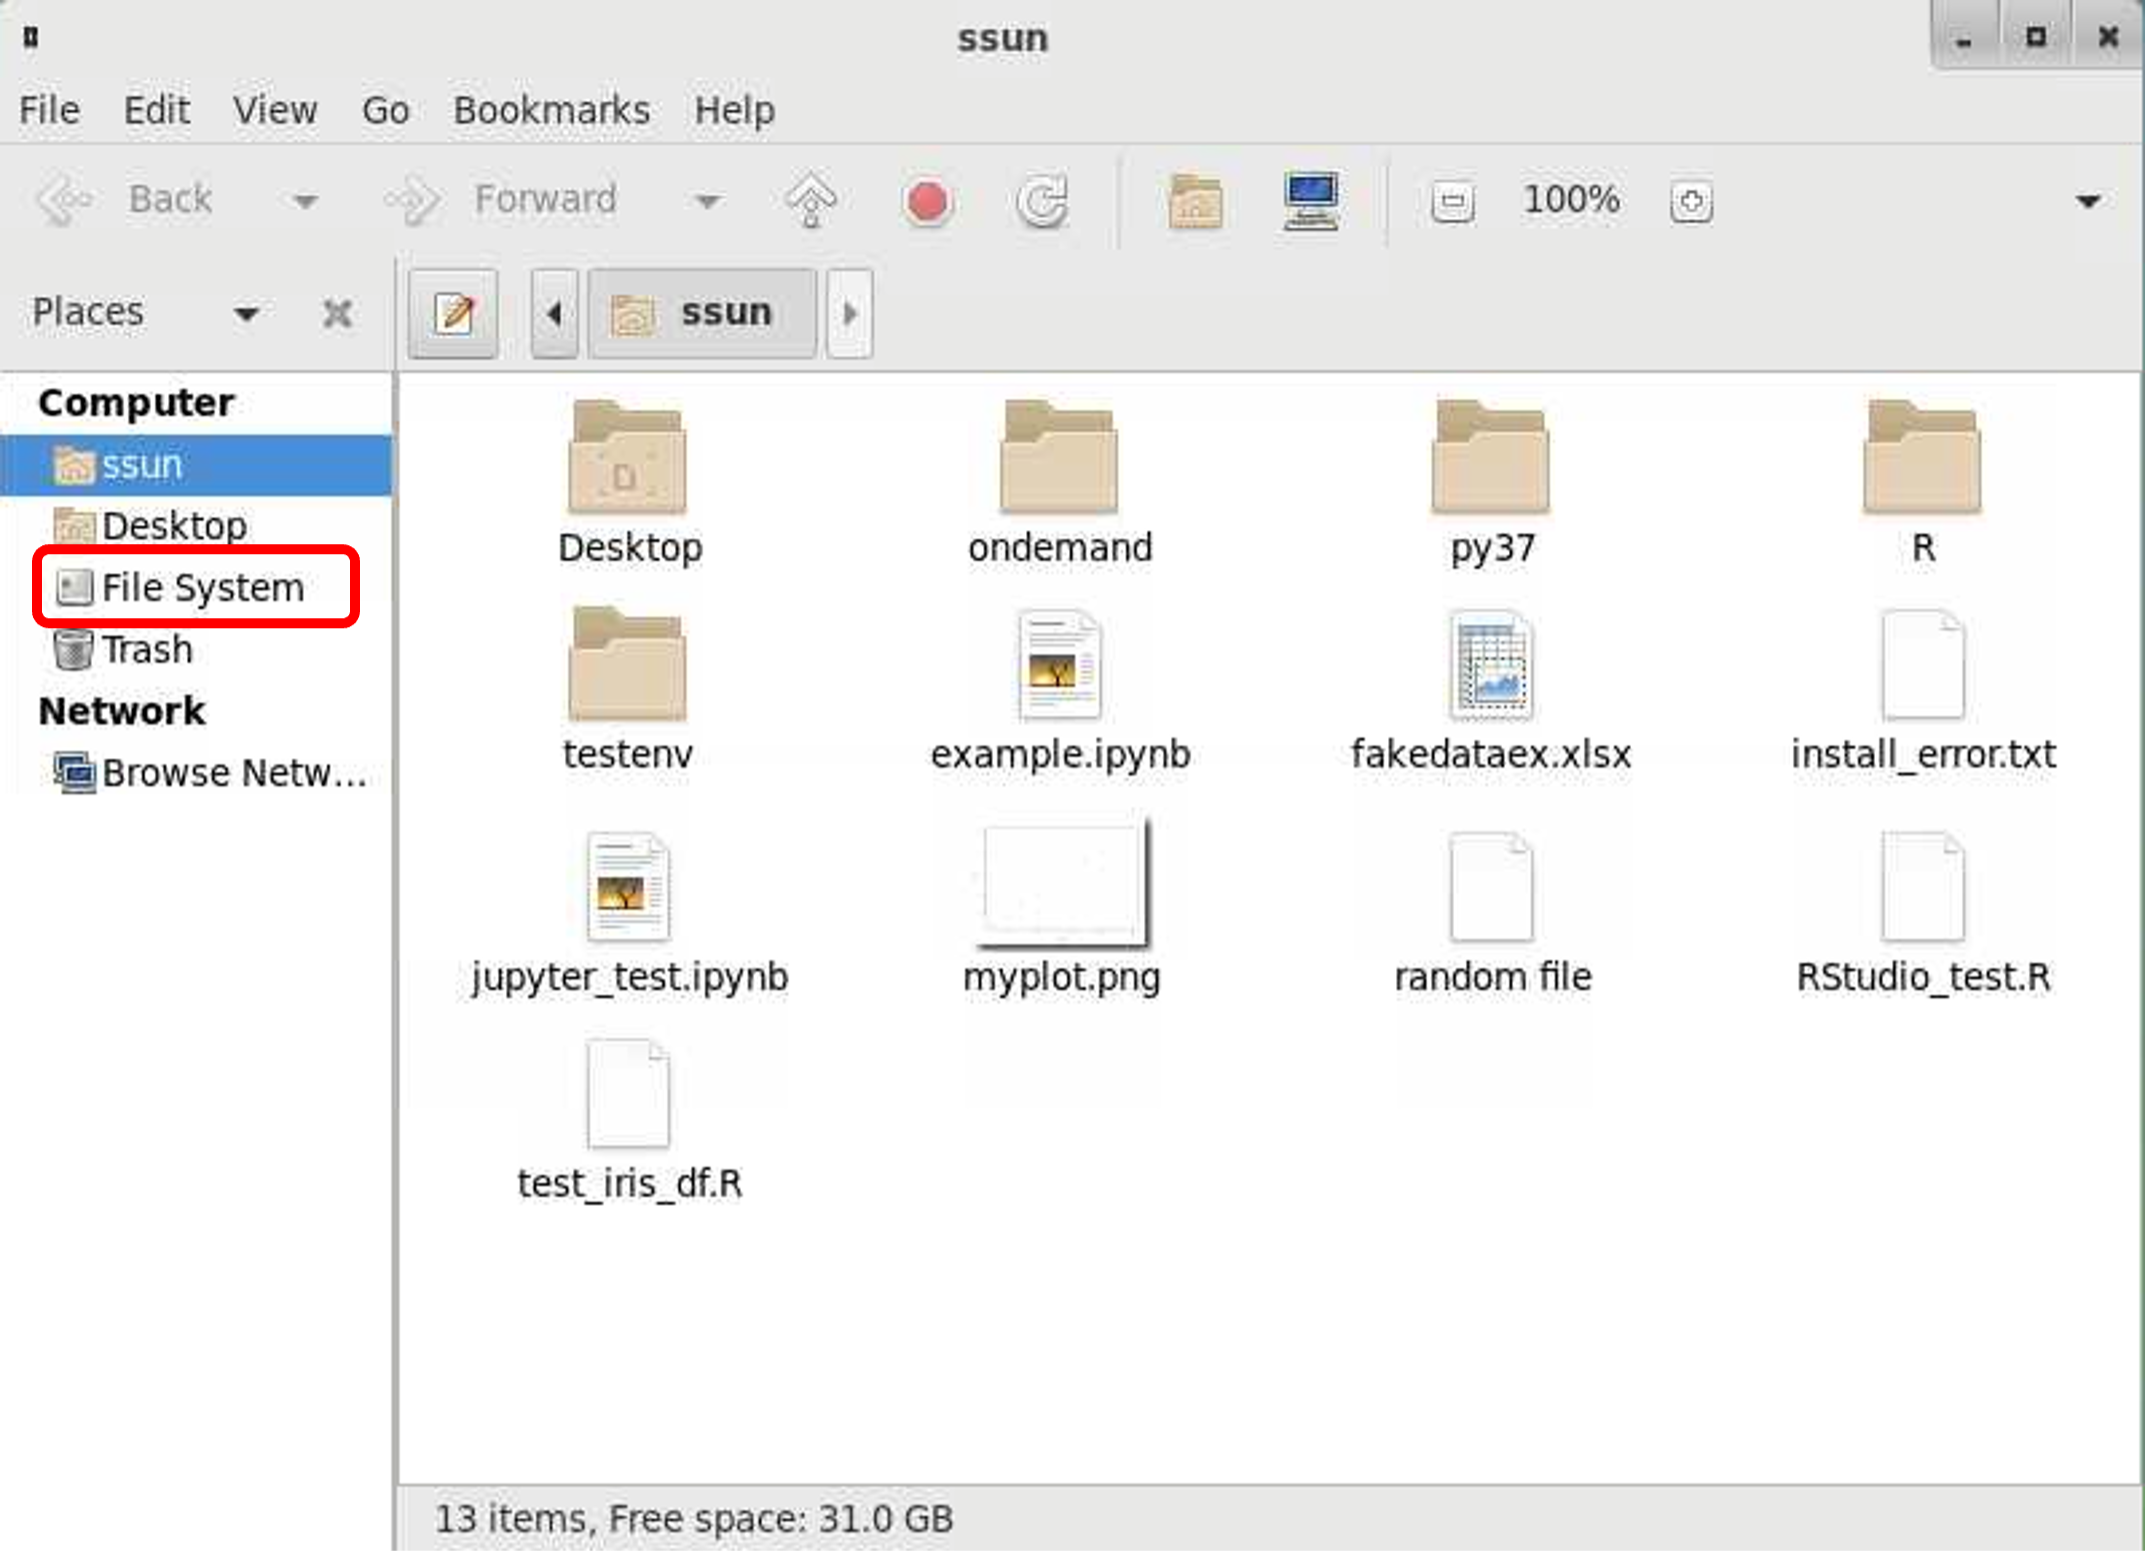
If you simply want to browse the files, you can do so using the desktop file manager. Once your interactive session has launched, you will see a desktop screen. On the left-hand side of the screen, you will see a file icon titled "<your username>’s Home”. Click on it (e.g., ssun’s Home).

A window will open showing you the files and directories inside your home directory. On the left-hand side click on “File System”
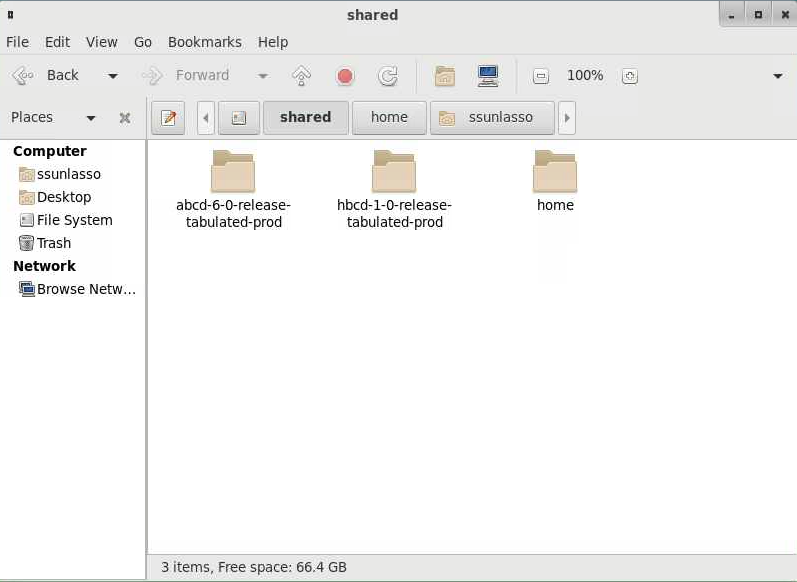
You will see a list of several directories. Click on the “shared” directory.
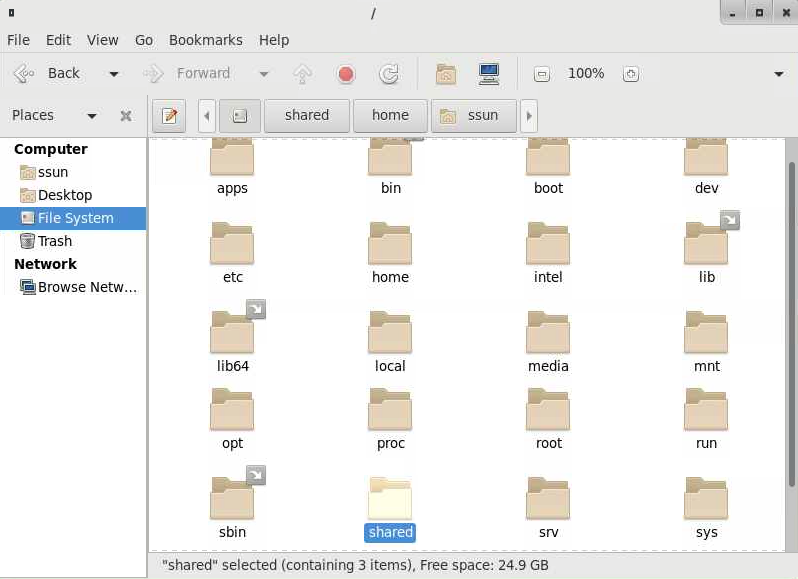
This is where you will find the directories containing ABCD and HBCD data. There may be an approximately 60-second delay before the data files appear in these directories as the files are being mounted.
Access data via the Linux desktop terminal
If you want to see the list of data files or perform any scripting, you can do so from the command line interface in the terminal.
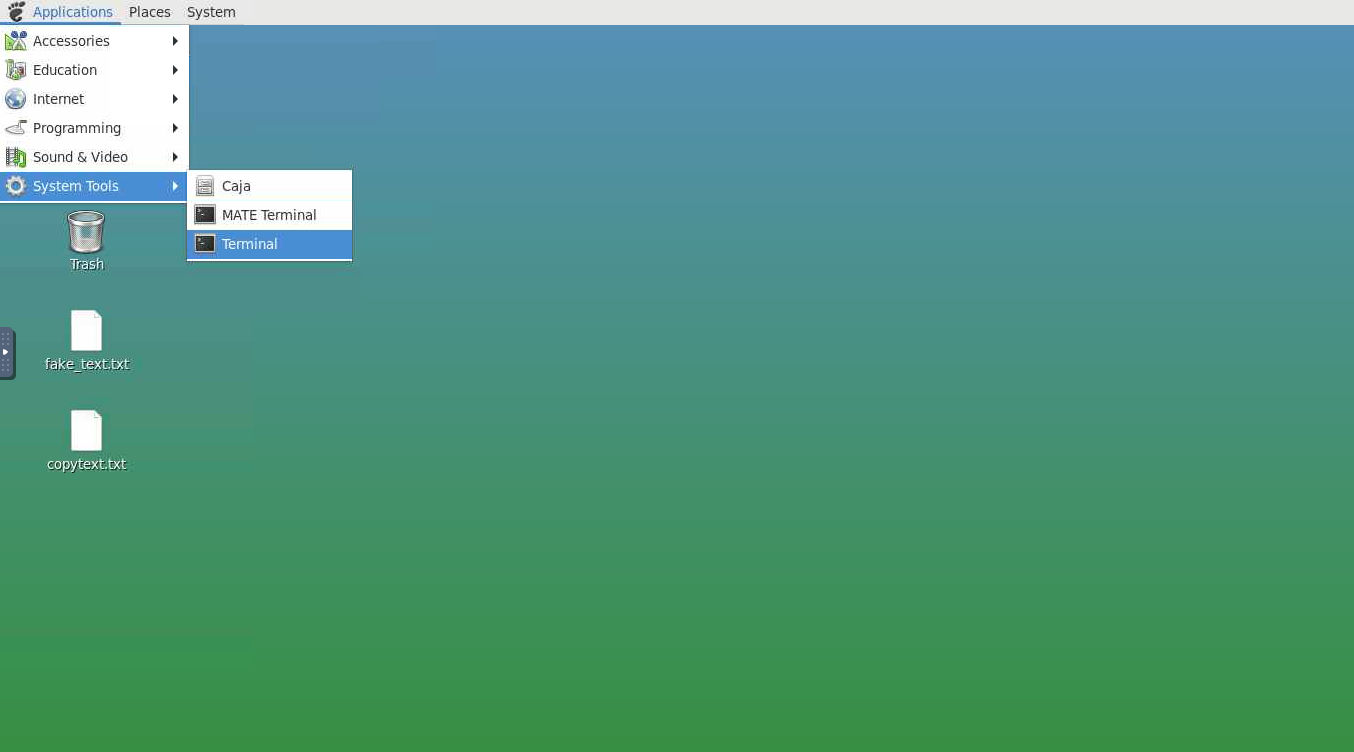
To open a terminal from the Linux desktop, click on “Applications” in the top left corner of the screen followed by “System Tools” and “Terminal”.
From the command line, change directory (cd) to /shared. This directory consists of two directories containing the ABCD and HBCD data.
The NBDC Study data are available at the following file paths:
- ABCD: /shared/release/abcd/dairc_files/rawdata/phenotype
- HBCD: /shared/release/hbcd/v2.0/hbcd/rawdata/phenotype

File System in Lasso SAFE
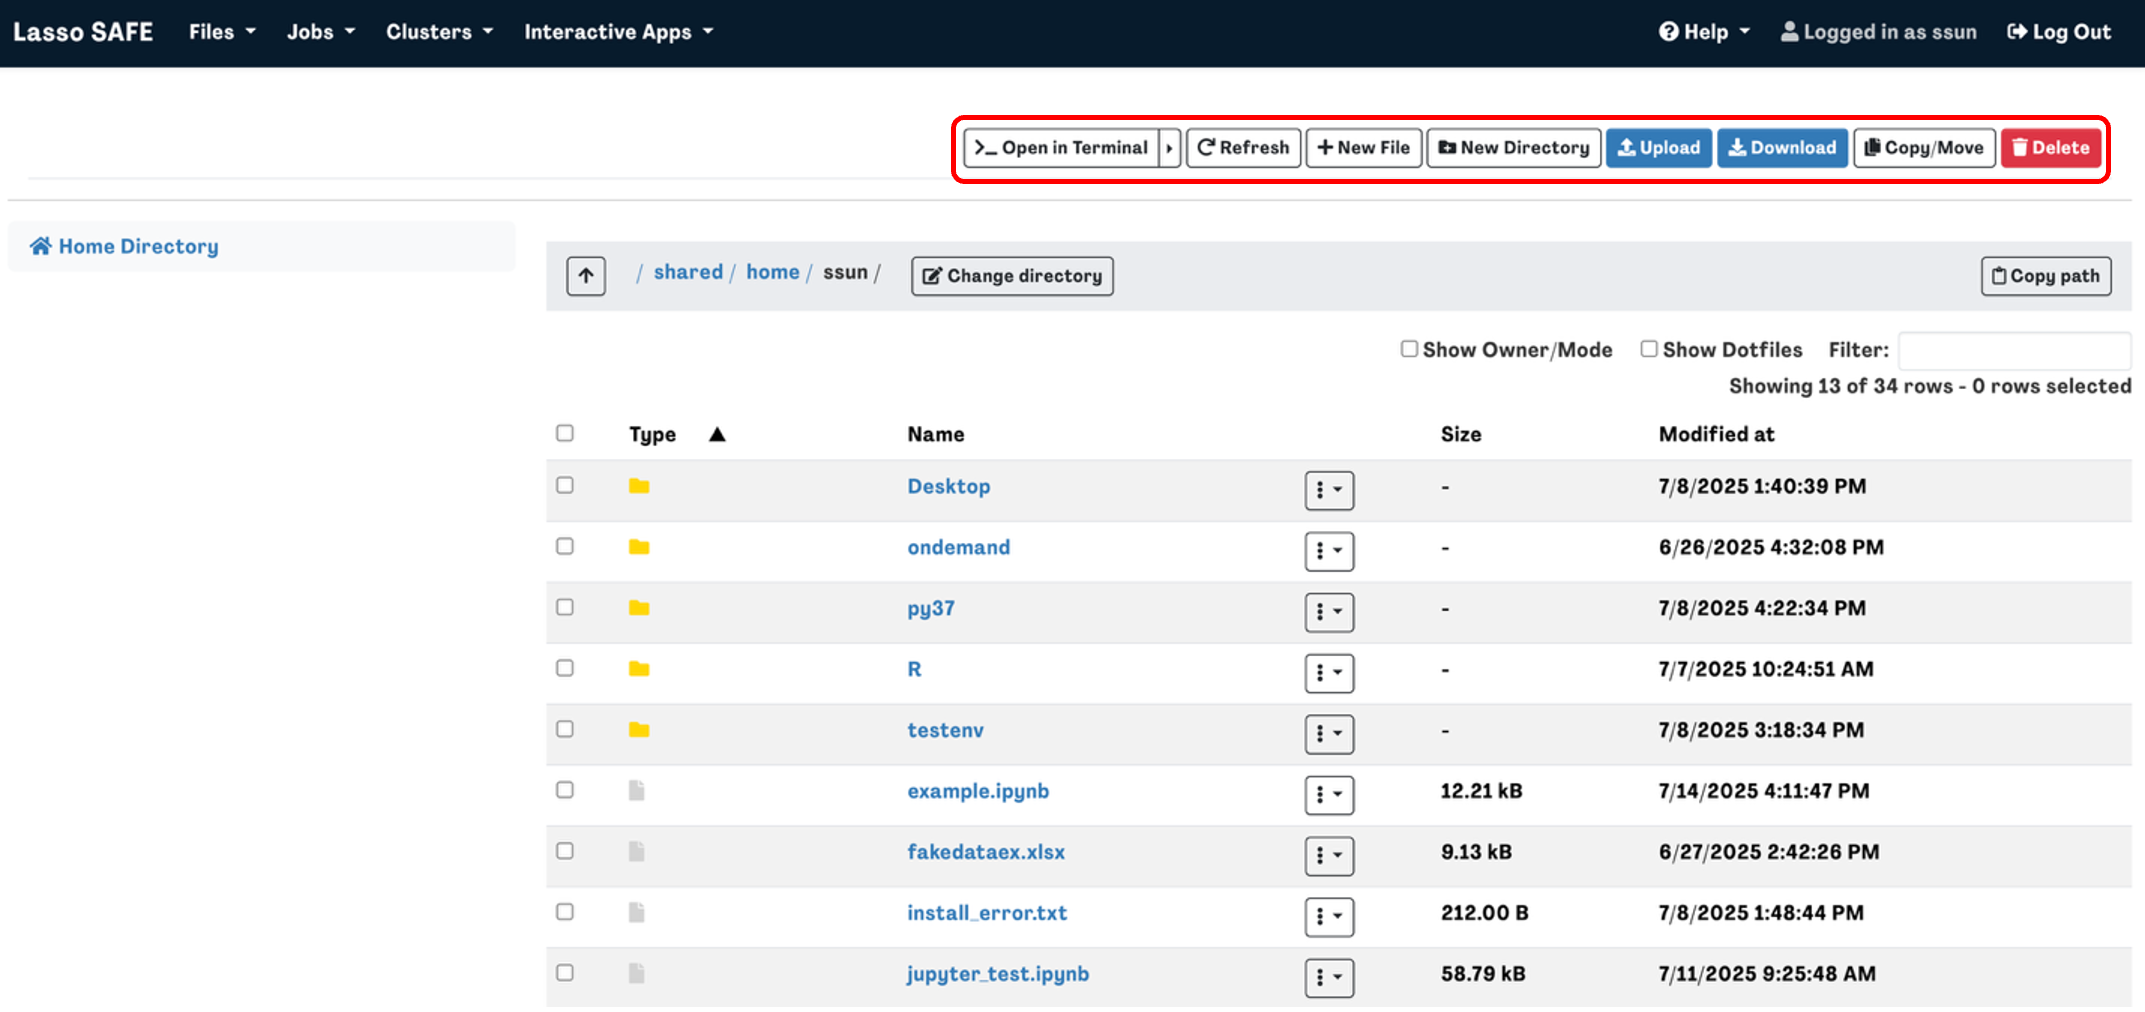
Click on the Files tab to see a dropdown menu listing your directories (right now there’s only one option). Click on “Home Directory”.

Here you will see your files and directories. You can use the buttons on the top right to upload or download files from/to your local computer and organize your directories and files.
To Copy/Move a file or directory, select the file you want to copy or move then click the Copy/Move button in the top right corner. You should then see your selection on the left-hand side of the screen.
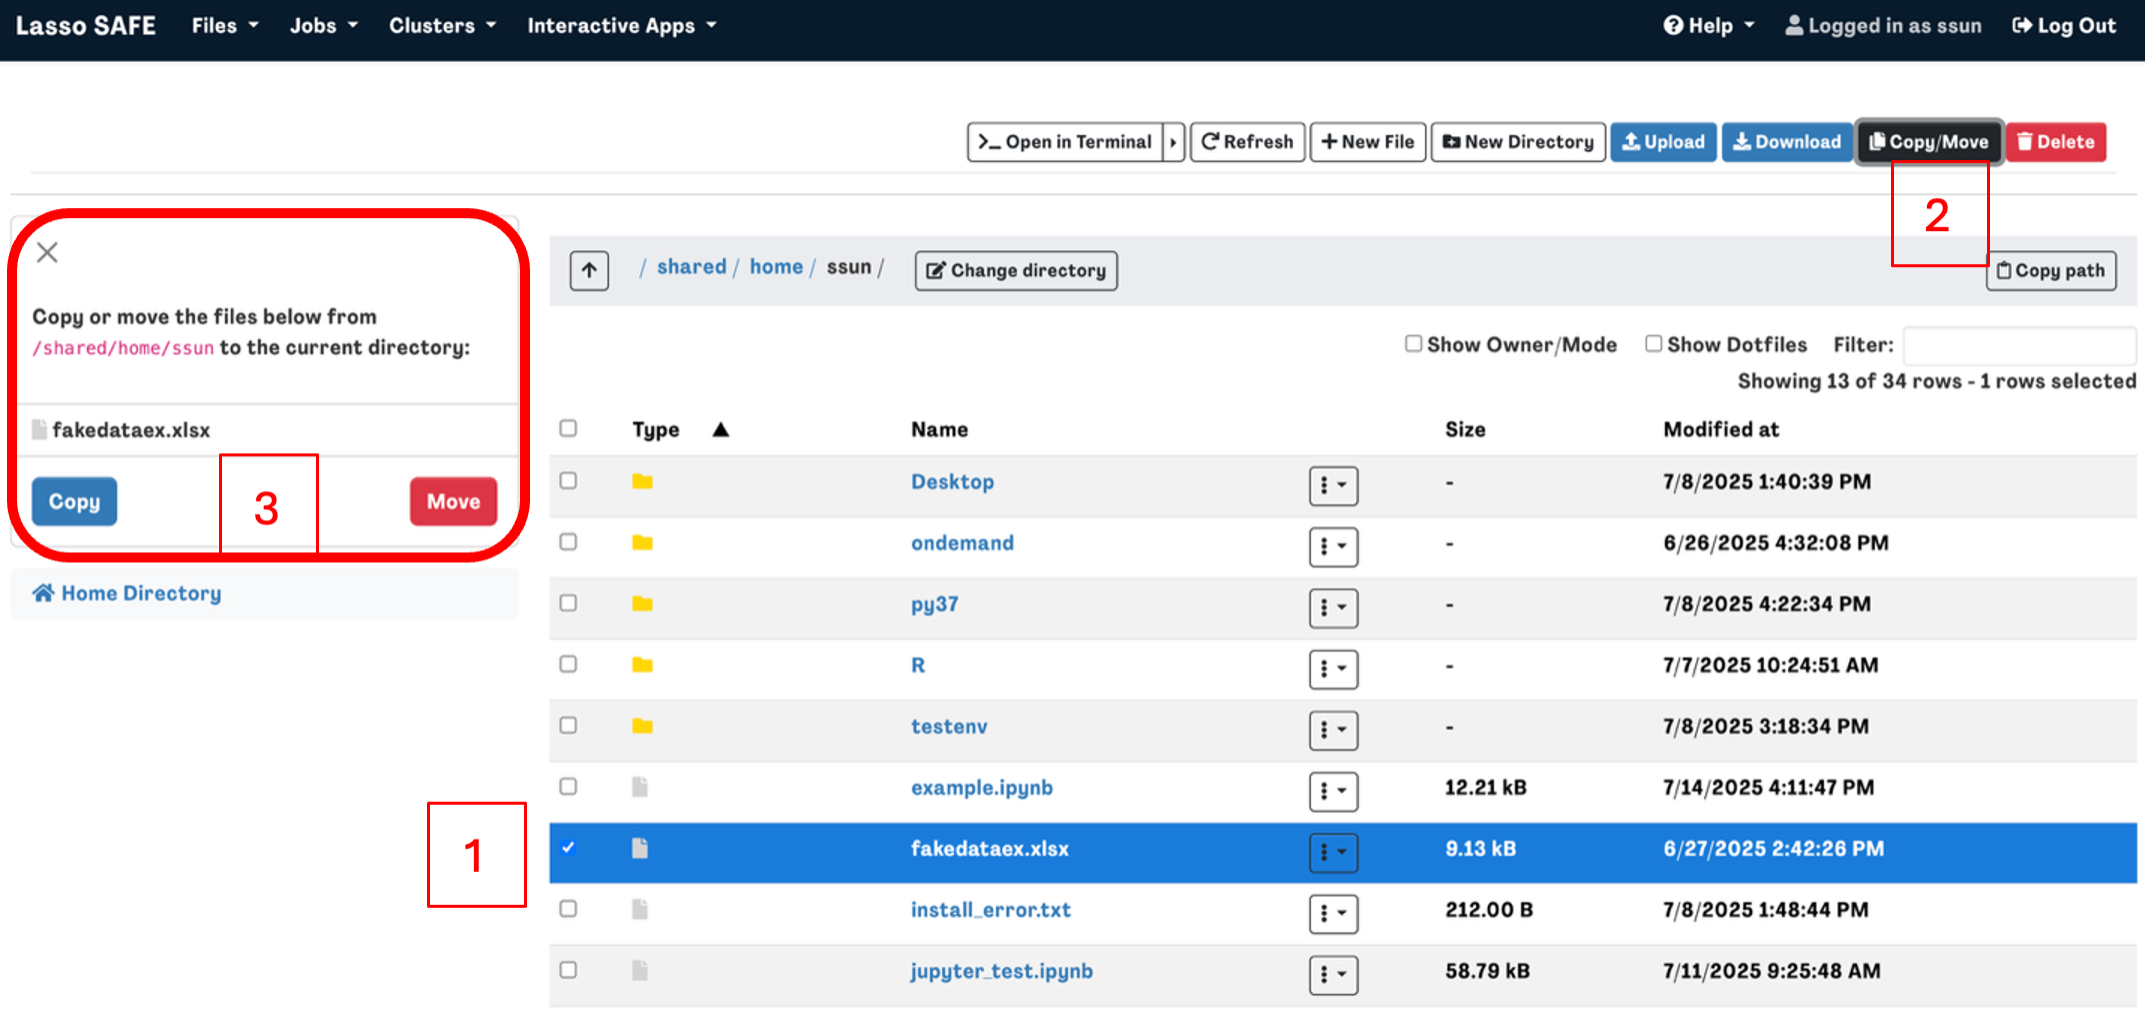
Navigate to the directory that you want to copy or move the file to then click Copy or Move on the left-hand side of the screen.
Alternatively, you can also click “>_Open in Terminal” to launch a terminal in a new browser screen where you can interact with the HPC environment using the command line rather than the GUI.

Jobs
What is a job
A job consists of a bash script that details what lines of code you want to run within the command line interface. To execute the script, you need to submit your job script to the scheduler, which decides which scripts to run and when depending on the resources that are available for your request.
Therefore, when your job gets executed also depends on the resources that you request, e.g., the time, number of processors (CPU), number of nodes, number of tasks, and amount of memory your job requires. The more resources you request, the longer you may have to wait until enough resources become available.
You can specify the resources you need inside your job script as follows:
#SBATCH --job-name=NameofJob
#SBATCH --time=1:00:00
#SBATCH --mem-per-cpu=1024M
See here for a full list of specifications you can list:
https://slurm.schedmd.com/sbatch.html
Examples of job scripts from compute Canada:
https://docs.alliancecan.ca/wiki/Running_jobs#Examples_of_job_scripts
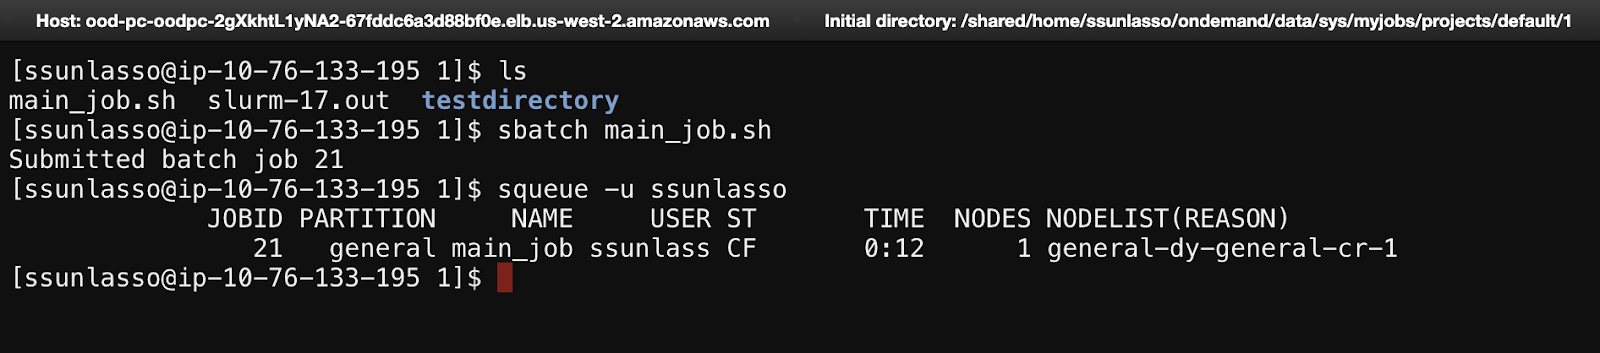
How to submit a job using the command line interface (terminal)
The main commands you will use to interact with the job scheduler from the command line are:
- srun: to queue an interactive job
- sbatch: to queue a job
- squeue: to view the job queue and see the statuses of jobs
- Use squeue -u yourusername to only see your own jobs (faster)
- scancel: to cancel a job from the queue
How to submit a job using the GUI
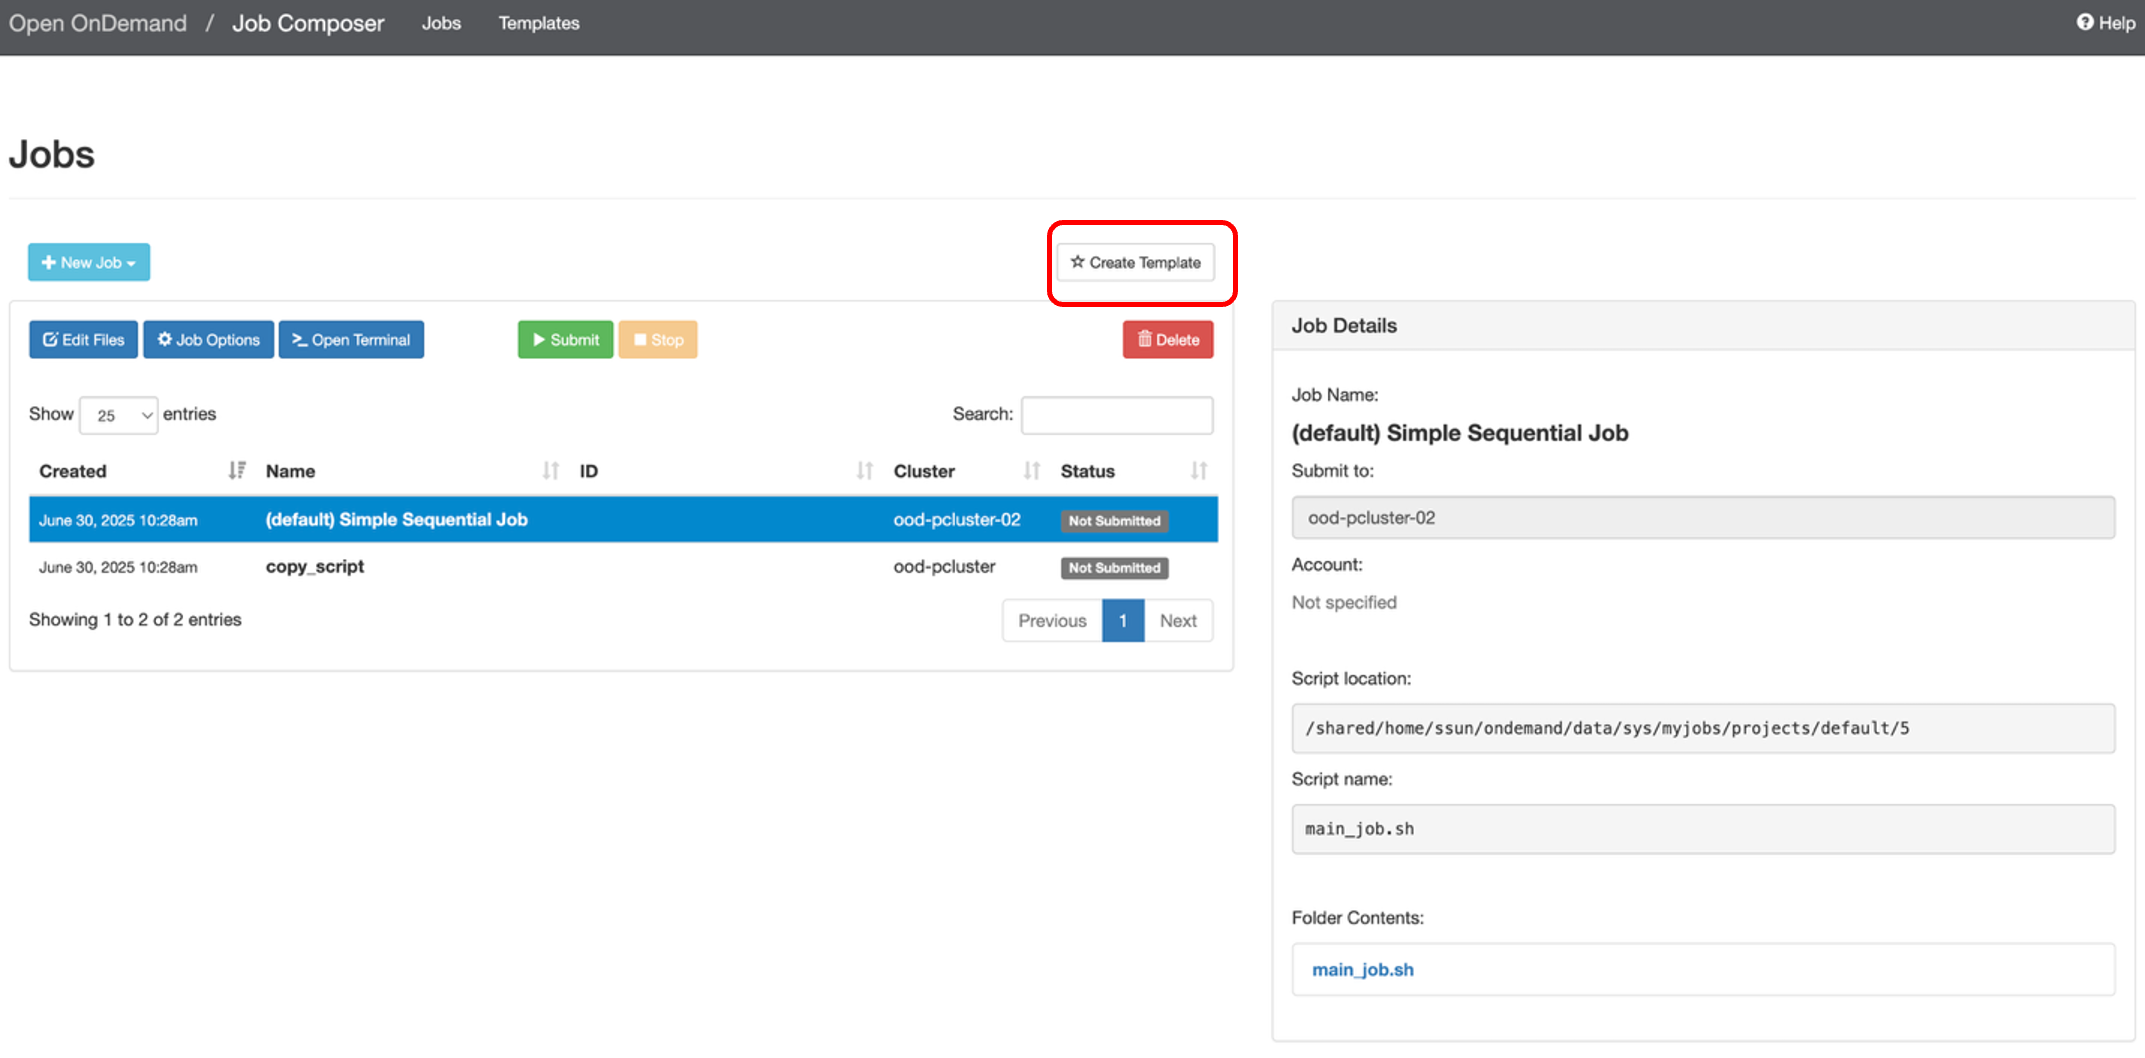
Click on the Jobs tab to reveal a dropdown menu consisting of Active Jobs and Job Composer.
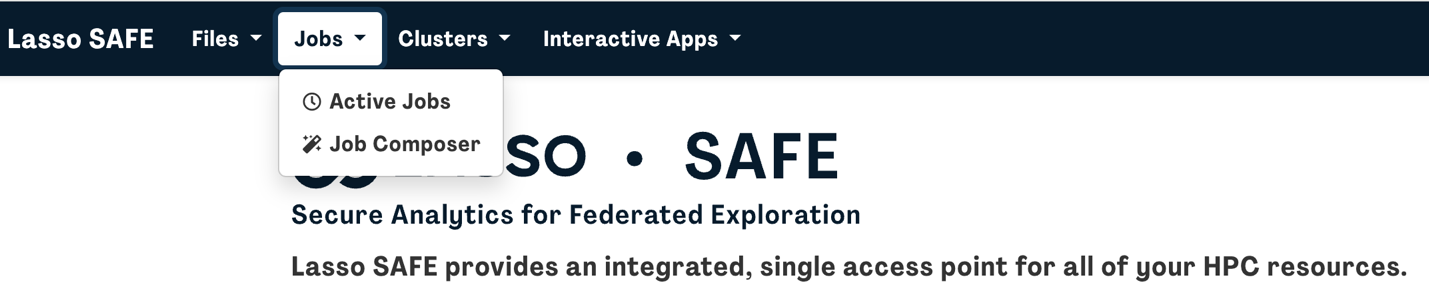
Click on Job Composer to create and edit bash scripts and manage jobs. Click on Active Jobs to monitor running jobs.
Selecting Job Composer will launch a new tab in your web browser.

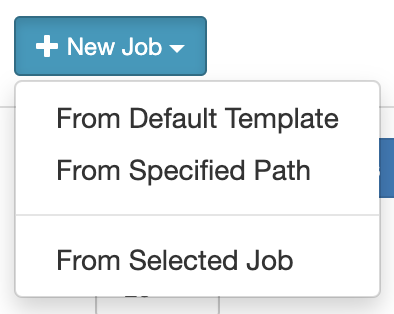
In the Job Composer dashboard: to create a job, click on “+ New Job”. You will be presented with 3 options:
- From Default Template: to start a new script from a default template script
- From Specified Path: to specify the path file to an already-existing script
- From Selected Job: to copy an existing script listed in your created jobs
You can see a list of your jobs here with more information in Job Details on the right.
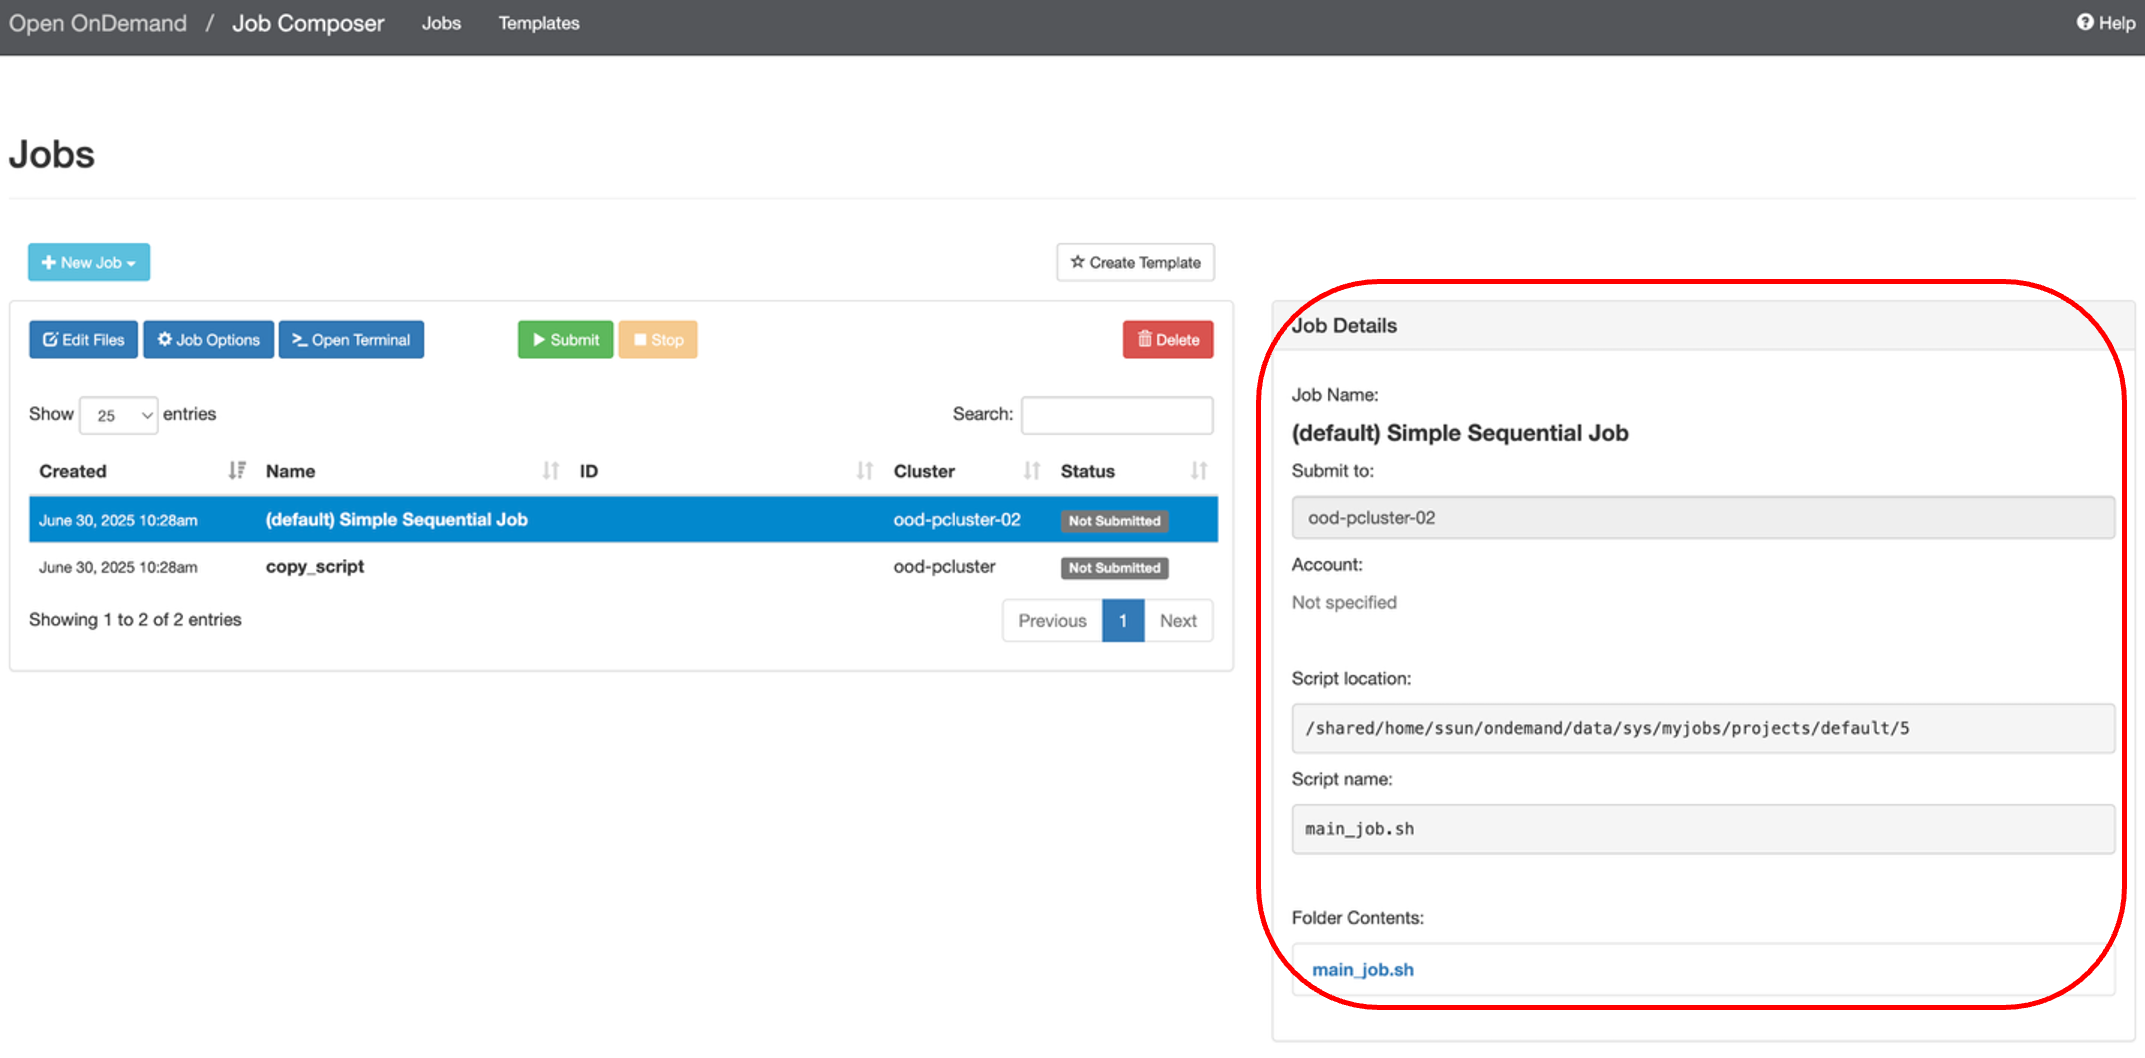
Note: new jobs are automatically created in a new directory at the following file path: /shared/home/<user>/ondemand/data/sys/myjobs/projects/default/<new directory>. You can see the file path in under Script location in the Job Details box on the right.
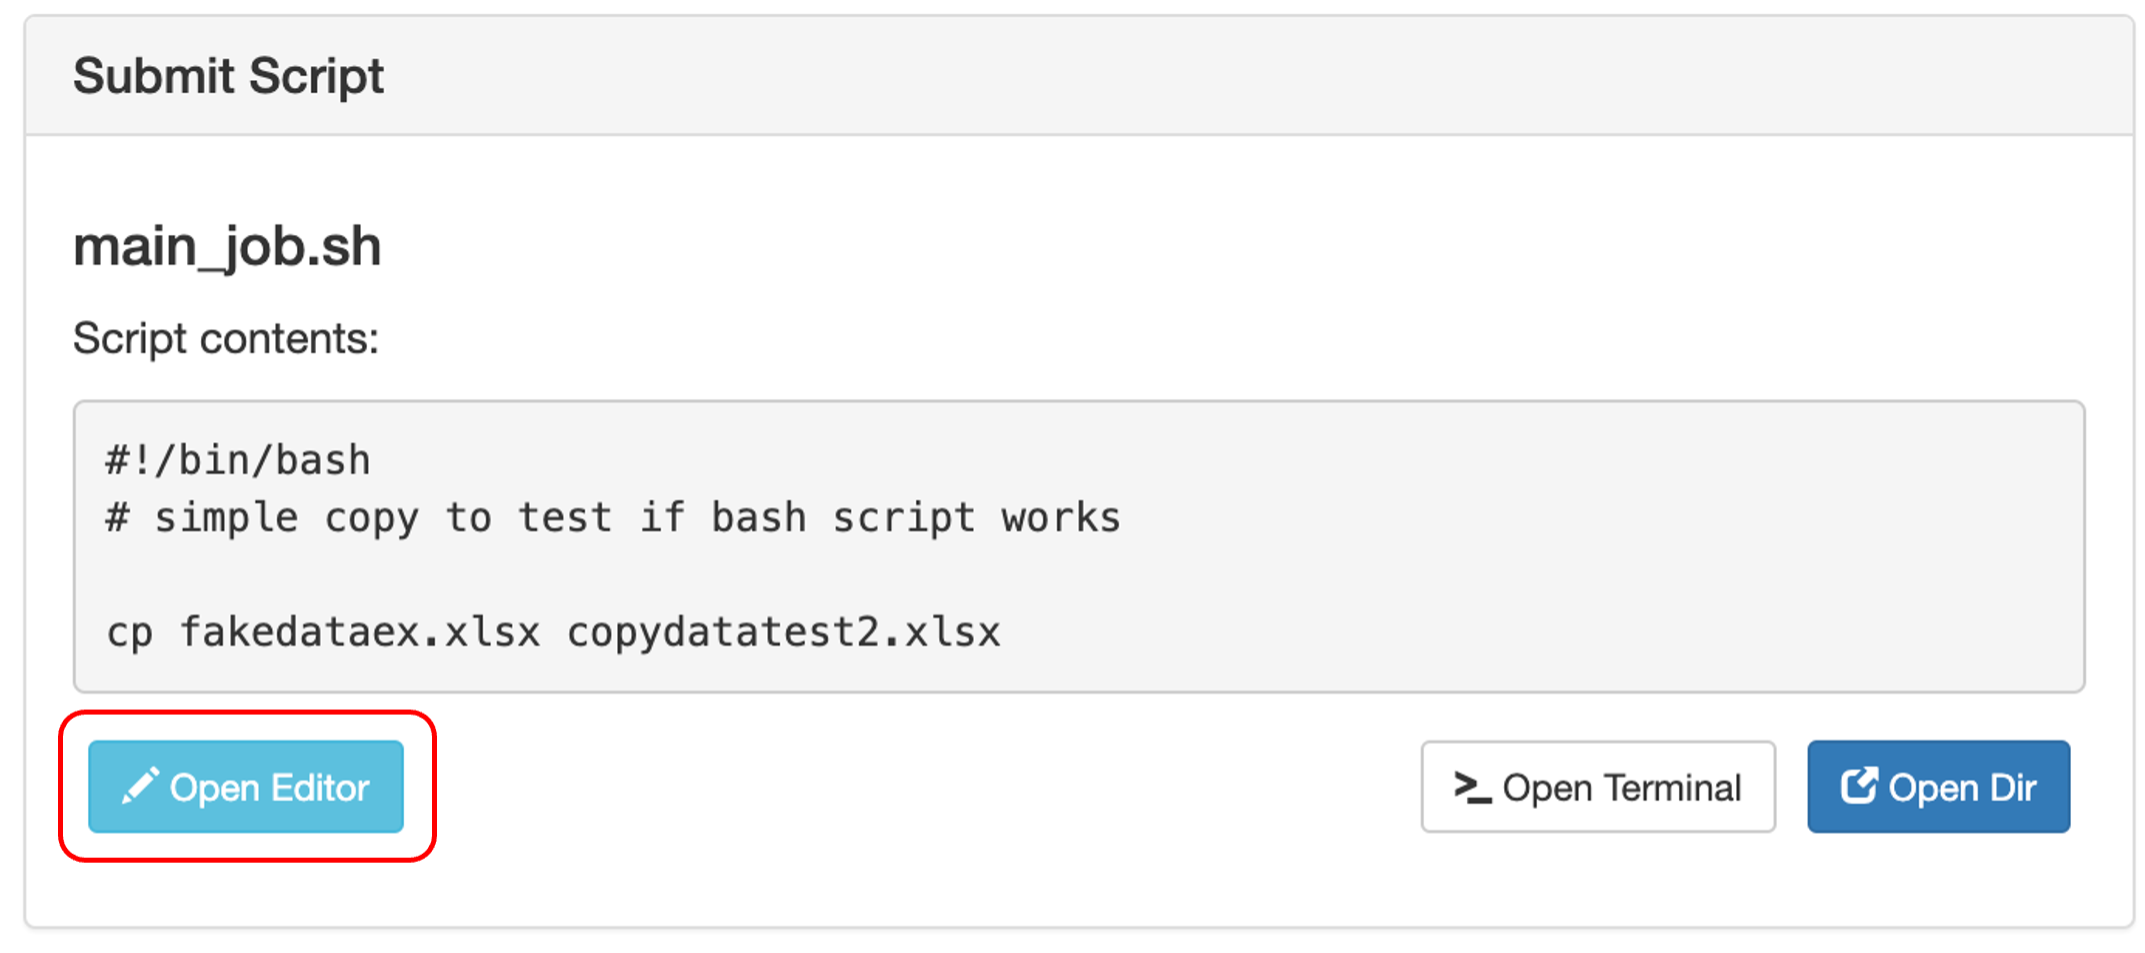
To edit your script, scroll down and on the right-hand side of the screen, you will see a Submit Script box. Click “Open Editor” and the script will open in a new browser tab where you can edit the script.
Click Save when you are done and exit the page.

When you are ready to submit your job click the green “Submit” button. You will see the status of your job change from “Not Submitted” to “Queued”
Templates
You can create your own job template by clicking on “Create Template”.
You can keep track of your templates by navigating to the Templates webpage. If you want to submit a new job with one of your templates, select the template and then click “Create New Job” on the right-hand side of the screen.

This will create a new job in the Jobs page, where you can open the script editor (click on the new job, scroll down, and click “Open Editor”) and make any necessary edits.
How to submit your analysis as a job
To perform analyses using Jupyter or RStudio, you need to request an interactive session and wait for your session to begin. The wait time may vary depending on the system load, which is not ideal for some users who are unavailable when their session begins.
Instead of being on stand-by and waiting for your session to begin, you can submit your analysis as a job. Your job will enter the queue and run the analysis once your resources have been granted. Below are detailed instructions on how to set this up.
- Write your analysis script in python or R
- Be sure to include code that outputs your results, i.e., save your results or figures as images (JPG, PNG)
- The outputs will automatically save to the same directory as your analysis script unless you specify another file path
- Save your script (e.g., anaylsis_script.R or analysis_script.py)
- Create a bash script that runs the analysis script
- If applicable, you will also want to activate any virtual environments you have configured for your needs inside the bash script first
- e.g., name_of_env/bin/activate
- Be sure to include a line that will run your script
- R: Rscript analysis_script.R
- Python: python analysis_script.py
- TIP: you can set an e-mail notification for when your job ends
Here is an example of what this looks like all together:#!/bin/bash
#SBATCH --time=2:00:00
#SBATCH --mail-user=yourname@university.com
#SBATCH --mail-type=END
python analysis_script.py - Save your bash script (e.g., job_script.sh)
- If applicable, you will also want to activate any virtual environments you have configured for your needs inside the bash script first
- Submit this bash script as a job
- To submit this job from the command line interface, use sbatch job_script.sh or use the job composer
- View the results
- Navigate to the relevant directory where you saved your results and view the outputs
- If any errors occurred, view the corresponding output in slurm-[ID#].out
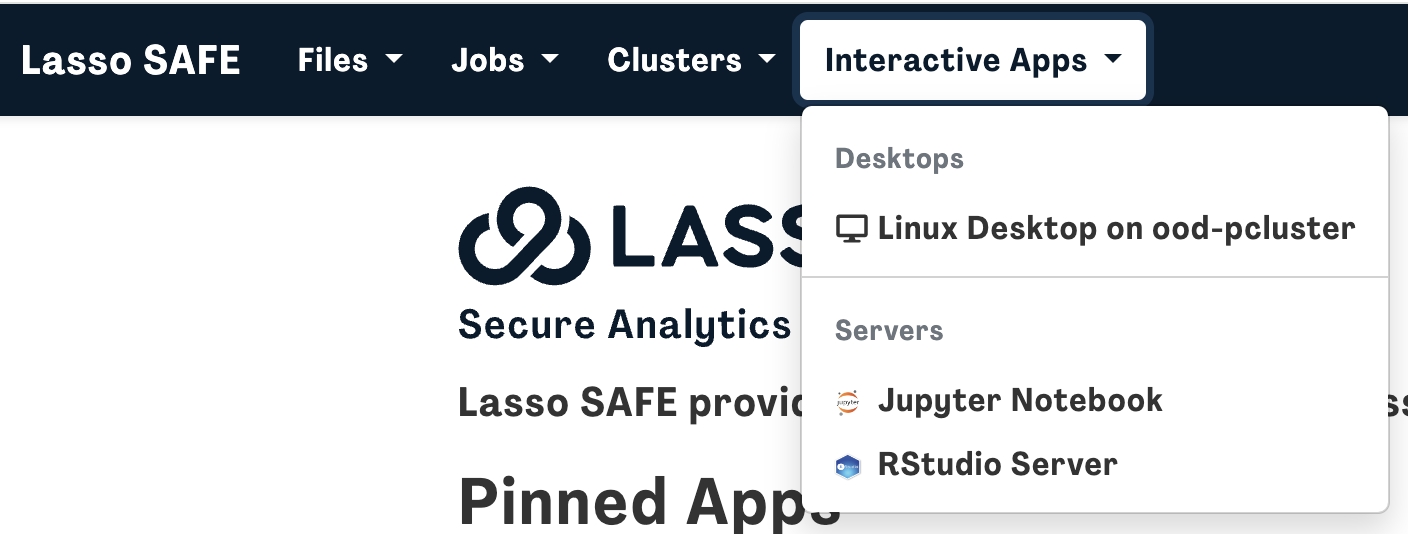
Interactive Apps
There are three types of interactive sessions you can launch:
- A VNC Linux Desktop
- Jupyter Notebook
- RStudio Server
You can launch these apps by:
- Clicking on the app from the homepage
OR
- Clicking Interactive Apps followed by the app you want to launch
Fill out the interactive session information based on your needs and then press launch.
You will be redirected to the “My Interactive Sessions” page.
My Interactive Sessions
Here you will see a list of your current and recent interactive sessions.
To launch an active session, click on “Connect to Jupyter/RStudio Server” or “Launch Linux Desktop on ood-pcluster" and the interactive session will launch in a new browser tab.
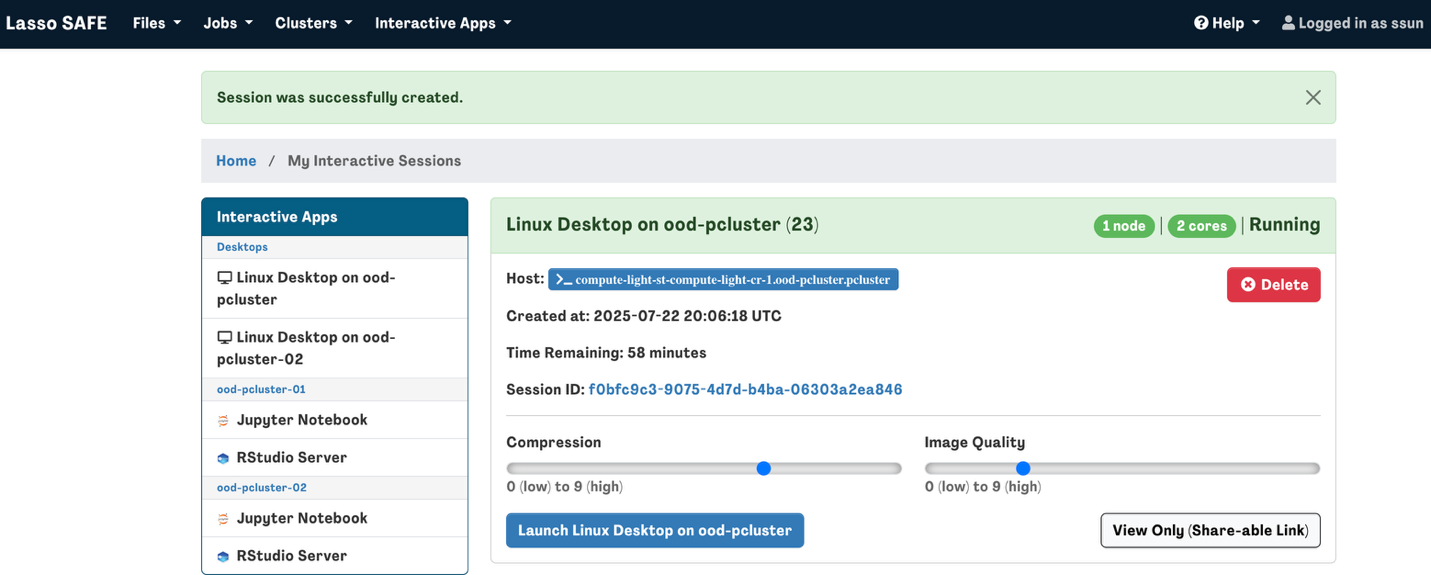
You will see how much time remains in your interactive session here. If you happen to close the web browser tab before your interactive session ends, you can navigate to the My Interactive Sessions page to continue/relaunch the session.
Troubleshooting
ABCD/HBCD Study directory not found in /shared
Wait 60s for the files to mount and try again. If not, check that you have the right data access permissions.
Job Stuck in Queue
Reduce the resources or time requested and try again (the more you request, the longer you will wait). If not, check if there is a potential outage or maxed out system availability on the cluster using via the system status.

Unable to use Python in terminal
Please note that the Lasso SAFE is a Linux operating system where “python” refers to python version 2 and “python3” refers to python version 3.
When installing python modules for your analyses, be sure to use pip3 (uses python3) rather than pip (uses python).
R plot not displaying in RMarkdown/Notebook
If you’re trying to visualize your data or analyses in a chunk and you are encountering an error like:
Error in .External2(C_X11, paste0("png::", filename), g$width, g$height, : unable to start device PNG.
Try putting the following code at the beginning of your script (before any attempt at plotting):
options(bitmapType = "cairo")
knitr::opts_chunk$set(dev = "png", dev.args = list(type = "cairo"))
Common R package problems & fixes
Tidyverse
- Sys.setenv( PKG_CONFIG_PATH = "/usr/local/ssl/lib/pkgconfig:/usr/local/ssl/lib64/pkgconfig", CFLAGS = "-I/usr/local/ssl/include", LDFLAGS = "-L/usr/local/ssl/lib -L/usr/local/ssl/lib64" )
- install.packages("openssl")
- These paths help R correctly locate and link against the updated OpenSSL libraries during package installation
Affected packages: lme4, glmnet
- Install a previous version of ‘nloptr’ dependency prior to installing lme4 (or glmnet)
- https://stackoverflow.com/questions/62900525/install-lme4-from-cran-on-ubuntu
Caret
Use Sys.setenv(TZ='America/New_York') to fix warnings about time zone (adjust time zone accordingly)
No space left on device
In close.connection(con): Problem closing connection: No space left on device
This error occurs when your home directory has reached its storage limit. Each user’s home directory is currently capped at 30 GB. Once this limit is reached, the system cannot write additional data, which triggers this warning.How to Check Available Space
- Right-click on your home directory.
- Select Properties from the menu.
- In the details window, look at the Free Space metric at the bottom.
Resolution
- Delete or archive unused files to free up space in your home directory.
- After sufficient space is available, retry your operatio
