Query Wizard
Take me to the query wizardInstructional Video
The Lasso Query Wizard allows users to quickly pull full instruments or tables of interest. This guide walks you through the entire process—from the basic workflow through our optional features.
Basic Workflow
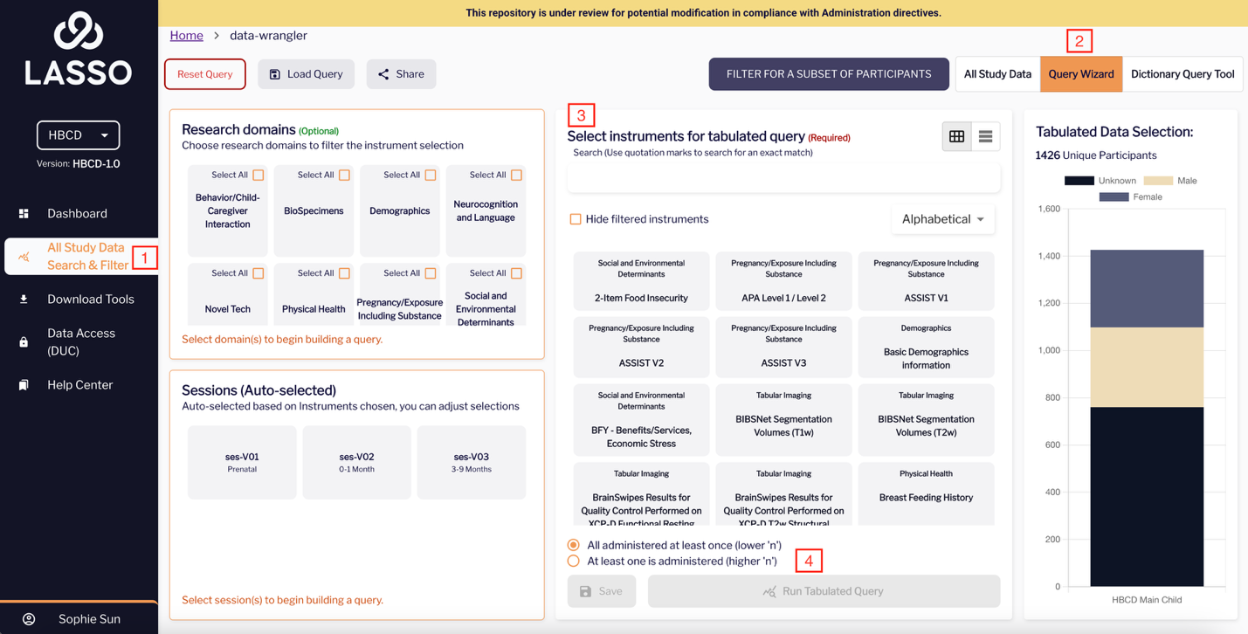
- Go to the All Study Data Search & Filter Module in the left-hand menu bar
- Click Query Wizard in the top right-hand corner
- Select instruments of interest using the search bar
- Run Tabulated Query
Note: All sessions are auto-selected based on instrument selection but you can unselect as needed
Optional Features
Applying Filters with AND/OR Logic
- All selected administered at least once (lower ‘n’) - AND LOGIC
- Produces a smaller dataset containing only overlapping responses.
- At least one of the selected is administered (higher ‘n’) - OR LOGIC
- Includes any session where one or more selected variables were administered. Once you've selected your data parameters, you can refine your results using logical filters:
- Includes any session where one or more selected variables were administered. Once you've selected your data parameters, you can refine your results using logical filters:

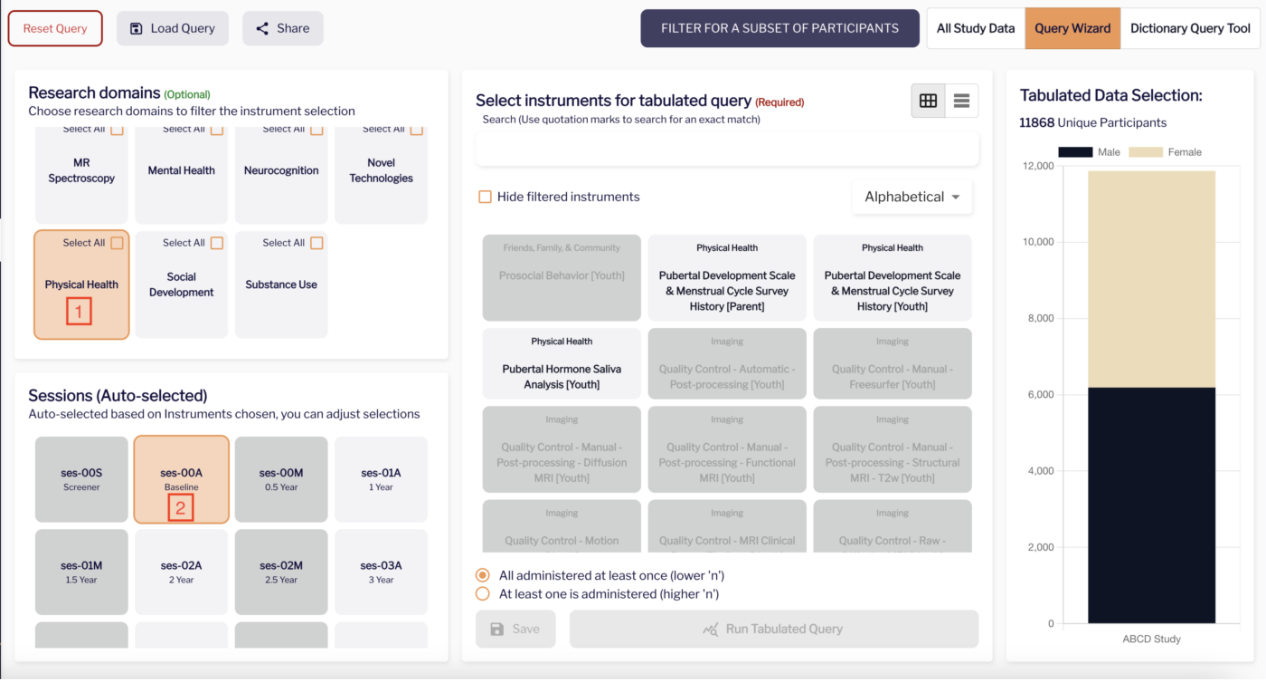
Filter by research domain
- Choose a research domain
- Select the sessions of interest and the available instruments will appear in light grey and can be selected as part of your query
Note: If you would like to use the ‘research domain’ filter, you must do this prior to selecting an instrument.
Filter by a list of participants
If you want to query data for a specific list of participants, you can do so by uploading the list of participant IDs you want.
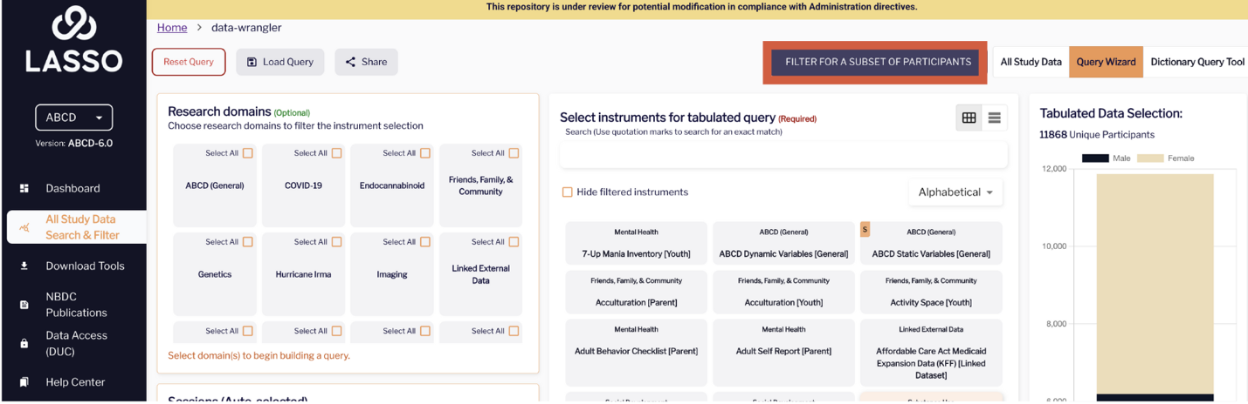
If you’d like to explore this filter in more detail, please consult the associated Feature Extension Guide for a comprehensive walkthrough.
Display Options
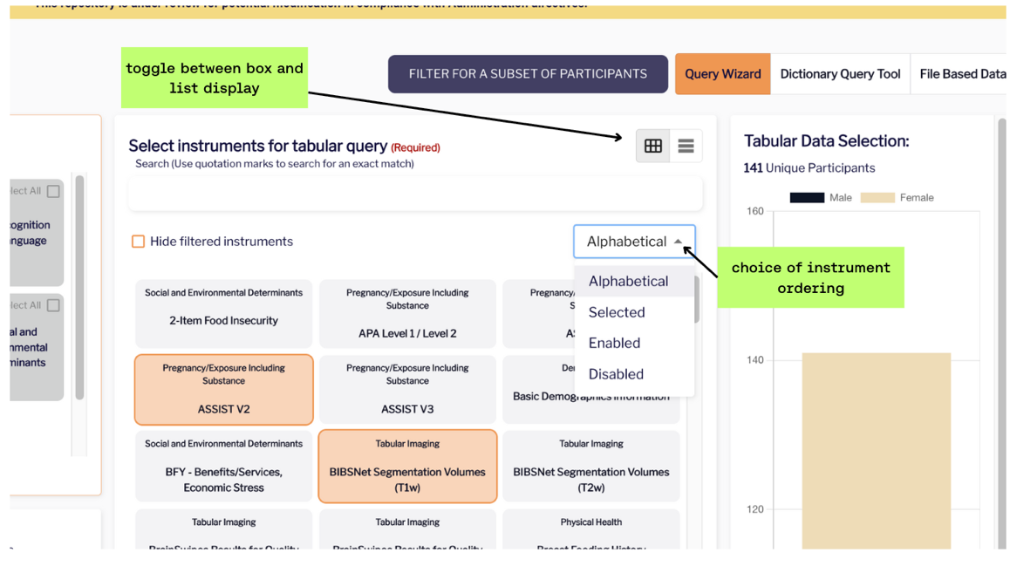
- Use the view toggle in the top-right corner of the instrument screen to switch between grid and list layouts.
- Lasso provides smart filtering options to streamline the instrument selection process:
- Alphabetical: Sort the instruments A–Z.
- Selected: View only instruments you’ve already chosen.
- Enabled: Shows instruments that apply to your current selections.
- Disabled: Highlights instruments that don’t match your filters.
- Hide filtered instruments: Removes irrelevant items to keep your view focused.
Understanding Output Files
When your query completes, you’ll be prompted to download:
- Data Output – Your tabulated dataset of the instruments you chose in a csv file
- Shadow Matrix – A file showing reasons for missing values, helping you understand missingness patterns in your data. Note: missing values appear as “blanks” in the data output file.
Why the Shadow Matrix is useful: The shadow matrix gives you transparency into data gaps and enhances your ability to interpret the results accurately.
